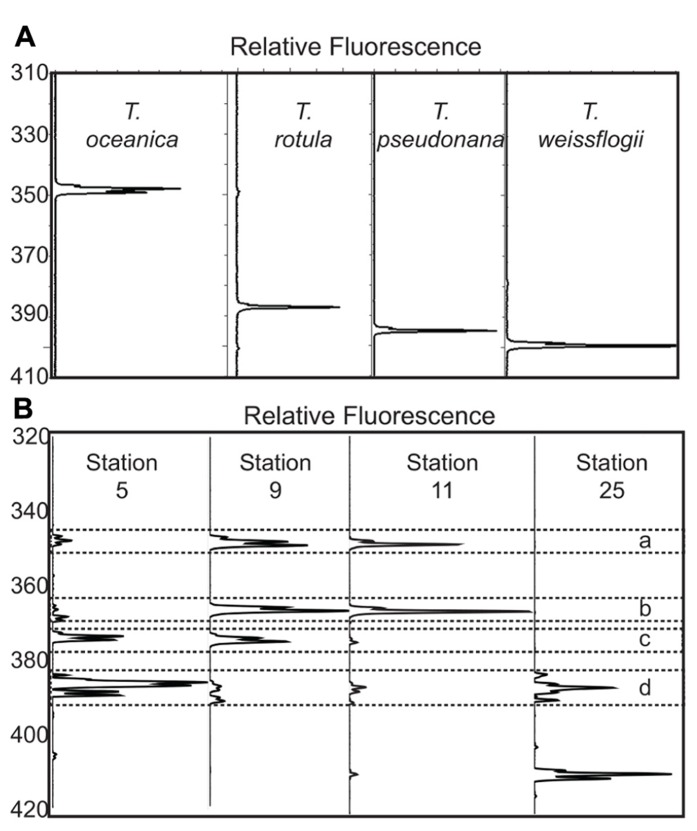
FIGURE 3.
(A) Fragment analysis plots from four cultured isolates of Thalassiosira (T. oceanica CCMP1005, T. rotula CCMP3096, T. pseudonana CCMP1335, and T. weissflogii CCMP1010). The x-axis for each trace is the fluorescence scaled to the largest peak for each sample. The y-axis is the length in bases associated with each peak, as determined by the 600-LIZ® standard. (B) Example of fragment analysis plots from four representative stations. The axes are the same as in 3A. Station 5 is a coastal station close to Vancouver Island, station 9 is a station at the coastal edge of the transect off Haida Gwaii, station 11 is at the center of the Haida eddy, and station 25 is from OSP. The dashed box marked “a” is surrounding the peaks at 348–349 bases associated with T. oceanica. The dashed boxes marked “b” surrounds peaks at 366–367 bases, which is associated with an unidentified Thalassiosira sp. for which we have ITS2 sequence data. The dashed box marked “c” surrounds the peaks at 374–375 bases associated with Minidiscus spp. The dashed box marked “d” surrounds the peaks between the sizes of 384 and 389 bases that are not associated with phylogenetically distinct species (Table 2).

