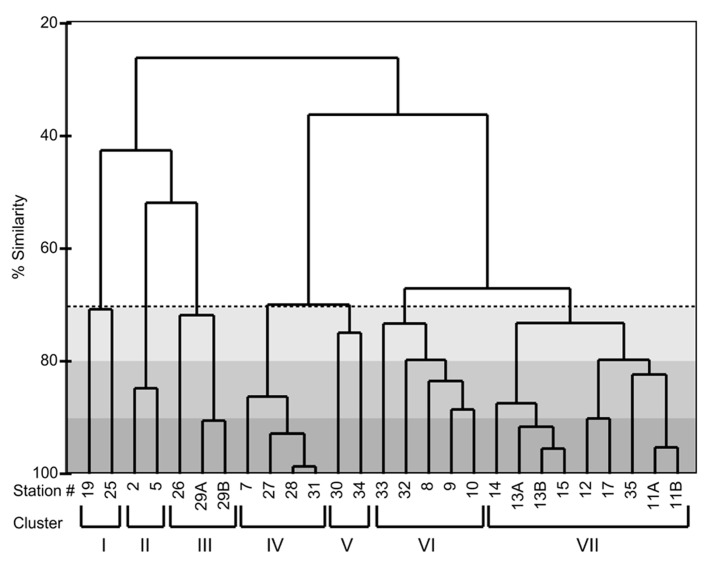
FIGURE 5.
A cluster dendrogram showing the Bray–Curtis similarity of the ITS2 region fragment analysis from field samples. The dashed line indicates the ≥70% similarity cut-off. The light gray shaded region indicates ≥80% similarity and darkest gray ≥90% similarity. The roman numerals at the bottom of the dendrogram refer to clusters of stations that are ≥70% similar to each other. Descriptions are as follows: I. OSP; II. Vancouver Coast; III. Haida Gwaii shallow; IV. Haida Gwaii deep; V. Cape St. James/former center of eddy; VI. Between Haida eddy and coast; VII. Haida eddy core and oceanic edge.

