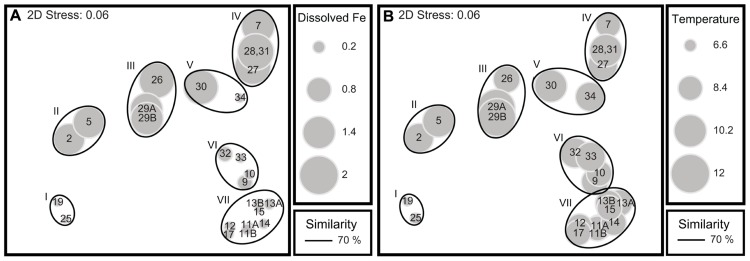
FIGURE 6.
(A,B) Multidimensional scaling plots of the Bray–Curtis similarity of the fragment analysis profiles of the ITS2 amplicon composition from field samples. The solid lines encircling various groups of markers correspond to the 70% similarity line on the Bray–Curtis dendrogram and the roman numerals and descriptions labeled on (A) are the same as those in Figures 4 and 5. Stations 8 and 35 are not included in the MDS analysis, as dissolved Fe was not measured at those stations. (A) The size of each individual gray marker corresponds to the surface (10 m) dissolved Fe value measured at that station. (B) The size of each individual gray marker corresponds to the sea surface temperature value measured at that station. All corresponding environmental data is listed in Table 4.

