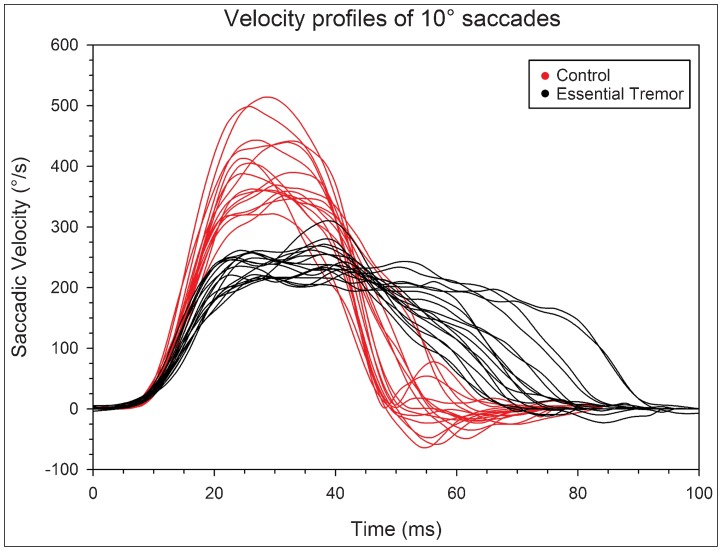
Figure 3. Velocity profiles of 10° saccades. Single velocity traces are shown for 18 representative essential tremor (ET) subjects and 18 control subjects.
The velocity profiles were aligned at t = 10 ms at the defined saccadic onset threshold (20°/second). Note the lower peak velocity, velocity plateau, and prolonged duration of saccades in ET subjects. The integral was taken of each individual velocity curve, and no difference was found between each group (p = 0.59). This further supports that despite abnormal velocity behavior during saccadic flight, that subjects with ET maintain accurate saccadic amplitudes, and reach the intended target position.

