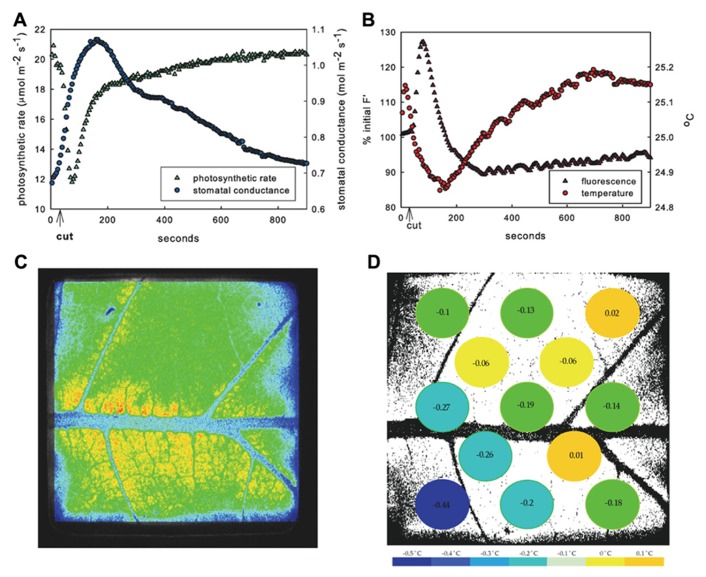
FIGURE 1.
Response of example leaf in 1.25 kPa VPD treatment. Mean response to leaf vein cut in entire measured leaf area of photosynthesis (green triangles) and stomatal conductance (blue circles) (A) and fluorescence (purple triangles) and temperature (red circles) (B) showing typical inverse relationship of photosynthetic rate and stomatal conductance. Image of fluorescence (C) and temperature in 13 leaf sub-areas (D) temperature change (°C) at peak time of average fluorescence response following cut.

