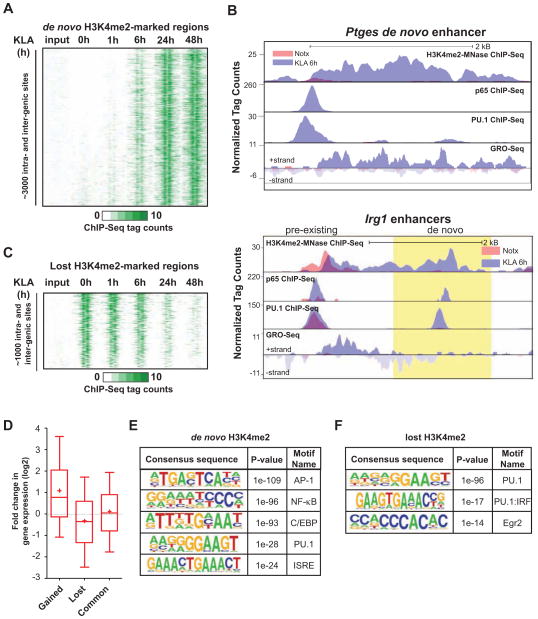
Figure 1. TLR4-induced remodeling of the macrophage enhancer landscape.
(A) Heat map of normalized tag densities for the H3K4me2-MNase histone mark at inter- and intragenic de novo enhancers. Two kb regions are shown centered at the midpoints of the nucleosome free regions (NFR).
(B) UCSC genome browser images for Ptges and Irg1 enhancers ~10 kb upstream of the TSS of the coding genes. Normalized tag counts for the indicated features are shown under no treatment (Notx) and 6h KLA stimulation. The region of de novo enhancer formation upstream of Irg1 is highlighted in yellow.
See also Figure S1E.
(C) Heat map of normalized tag densities for the H3K4me2-MNase histone mark at inter- and intragenic enhancers lost upon KLA-stimulation. Two kb regions are shown centered at the midpoints of the NFRs.
(D) Box-and-whisker plots of the fold change in expression of genes located < 100 kB from the gained, lost or common enhancers. Boxes encompass the 25th to 75th % changes. Whiskers extend to 10th and 90th percentiles. The median fold change is indicated by the central horizontal bar and the mean fold change upon 1h KLA-treatment is indicated by +.
(E and F) Sequence motifs associated with (E) de novo and (F) lost H3K4me2-marked enhancers. See also Figure S1.

