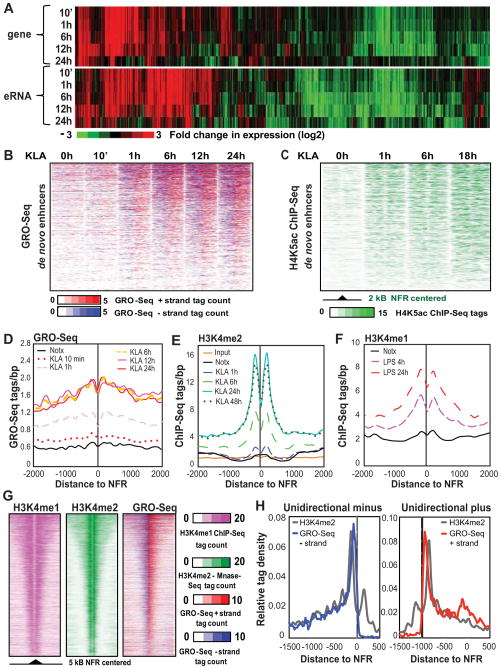
Figure 3. Relationship between eRNA expression and deposition of H4K5ac and H3K4me2.
(A) Hierarchical clustering and heat map of the fold change in eRNA and coding gene expression (eRNAs: RPKM>1, genes: FDR 0.01, RPKM>0.5). See also Figure S3A–S3D.
(B) Heat maps of normalized tag densities for GRO-Seq around 2 kb of de novo enhancers centered to nucleosome free regions as a function of time following KLA treatment.
(C) Temporal profile of H4K5ac normalized tag densities tag counts around 2 kb of de novo enhancers as a function of time following KLA treatment. See also Figure S3E–S3G.
(D) Distribution of GRO-Seq tags at around NFRs at de novo H3K4me2-associated enhancers as a function of time following KLA treatment.
(E) Temporal profile of change in H3K4me2-MNase ChIP-Seq tags at de novo enhancers following KLA treatment. See also Figure S3H.
(F) Coverage of H3K4me1 ChIP-Seq tags at de novo enhancers following LPS treatment (Ostuni et al., 2013).
(G) Heat map comparing the distribution of intergenic H3K4me1 and H3K4me2 regions and GRO-Seq signal. Pre-existing H3K4me2 regions centered to NFR are presented. See also Figure S3I.
(H) Comparison of GRO-Seq and H3K4me2 cumulative tag densities at enhancers characterized by exclusive unidirectional eRNA initiation from minus (left) or plus (strands). GRO-Seq signal is multiplied by ten compared to H3K4me2 signal.

