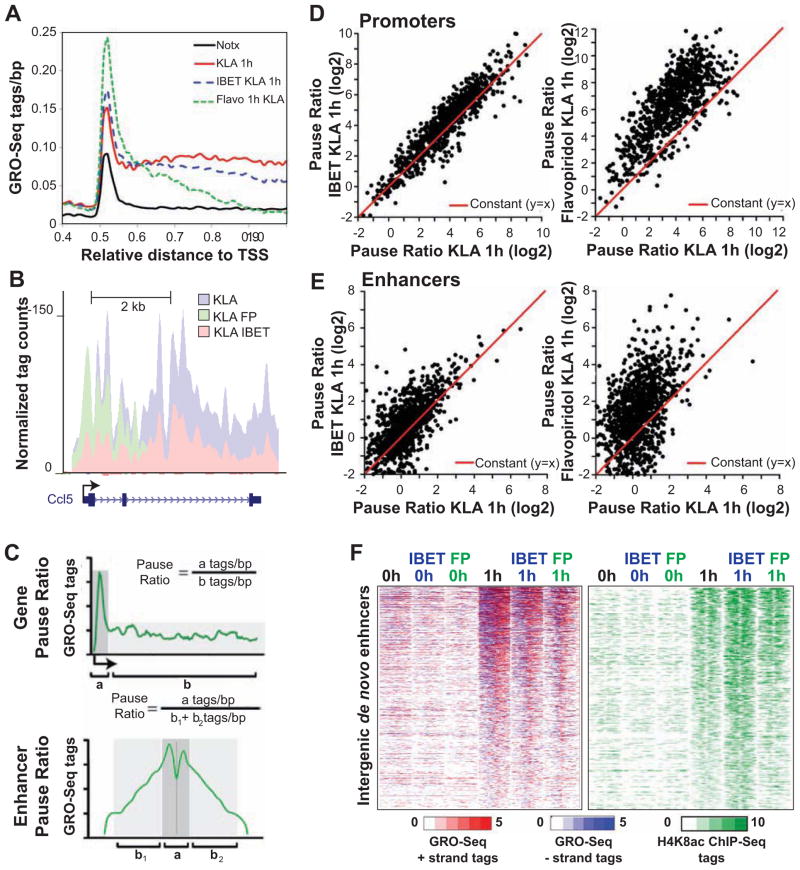
Figure 4. IBET151 and flavopiridol decrease mRNA and eRNA elongation without affecting H4K8ac levels.
(A) Distribution of average GRO-Seq tag densities on the + strand around the TSS of KLA- induced genes subject to inhibition by IBET151 or flavopiridol (Flavo) pretreatment (1 μM).
(B) UCSC Genome browser image depicting normalized GRO-Seq tag counts at Ccl5 coding gene in KLA-stimulated cells pretreated or not with Flavopiridol or IBET151 inhibitor for 1h.
(C) The Gene Pause Ratio (upper figure) was defined as the ratio of strand-specific GRO-Seq tag density found within the proximal promoter (a = −25 bp to +175 bp) to the GRO-Seq tag density found at the gene body (b = +175 to end of the gene). The Enhancer Pause Ratio (lower figure) was calculated as the ratio of GRO-Seq tag density found within the proximal enhancer region (a = +/− 250 bp) to the GRO-Seq tag density found at the distal enhancer region (b1/2= +/− 250 bp to +/− 1250 bp).
(D) Scatter plot of mRNA Pause Ratios comparing KLA-stimulated control to IBET151-pretreated (left) or Flavopiridol pretreated samples. KLA-induced genes exhibiting promoter RPKM > 2 were included in the analysis.
(E) Scatter plot of the change in enhancer Pause Ratios comparing KLA-stimulated control to IBET151-pretreated (left) or Flavopiridol pretreated samples. De novo enhancers exhibiting >1.5-induction in eRNA level and RPKM > 0.5 were included in the analysis. See also Figure S4.
(F) Heat maps of normalized tag densities for H4K8ac ChIP-Seq and GRO-Seq around 2 kb of de novo enhancers in KLA-stimulated control and IBET151 or Flavopiridol (FP) pretreated samples

