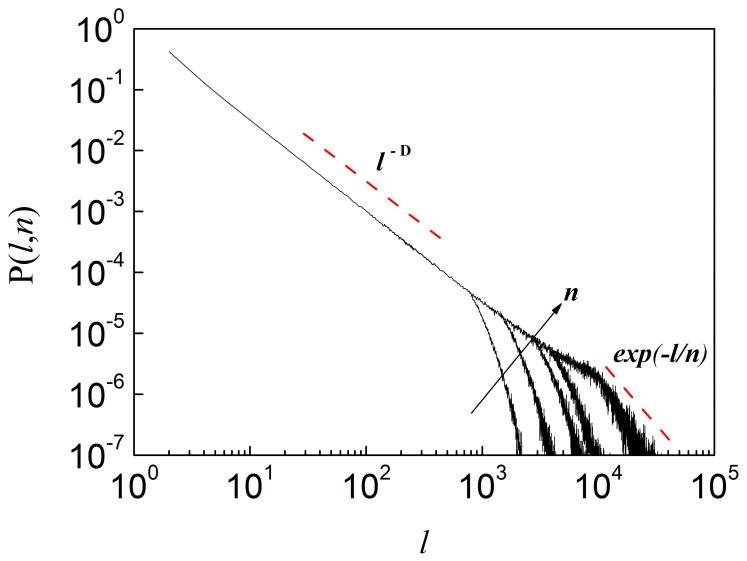
Figure 1. Cluster Length Probability Distribution.
Probability distribution function P(ℓ, n) of cluster lengths for a sequence with H ≈ 0.6 and L = 2 20. The moving average windows are n = 500, n = 1000, n = 2000, n = 3000 and n = 10000 (from left to right). As n increases, P(ℓ, n) becomes broader. The slope of the distribution becomes steeper for ℓ > n, corresponding to the onset of finite-size effects and exponentially decaying correlation.

