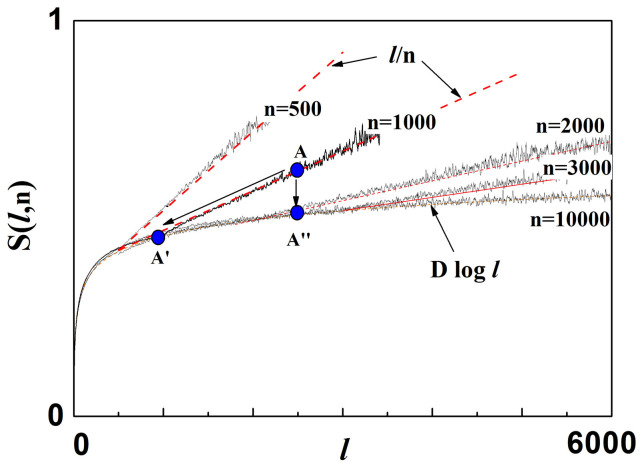
Figure 2. Cluster Entropy.
Entropy S(ℓ, n) of the clusters corresponding to the probability distribution function P(ℓ, n) plotted in Fig. 1. For small values of ℓ, the curves increase logarithmically as log ℓD and are n-invariant, while they vary as a linear function for larger values of ℓ, as expected according to equation (5).

