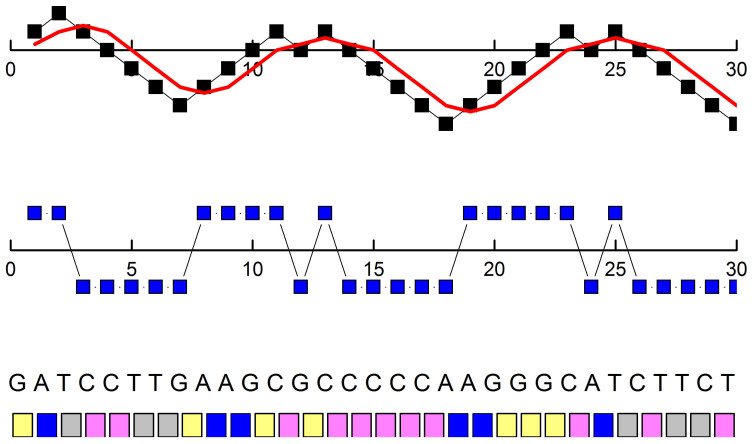
Figure 9. DNA Sequence Mapping Visualization.
Bottom: scheme of the first 30 ATGC bases of the sequence of the human chromosome 1. Middle: the sequence of +1 and −1 corresponding to the ATGC. Top: the DNA walk y(x) obtained by summing the sequence of +1 and −1 (black squares) with the moving average  with n = 3 (red curve).

