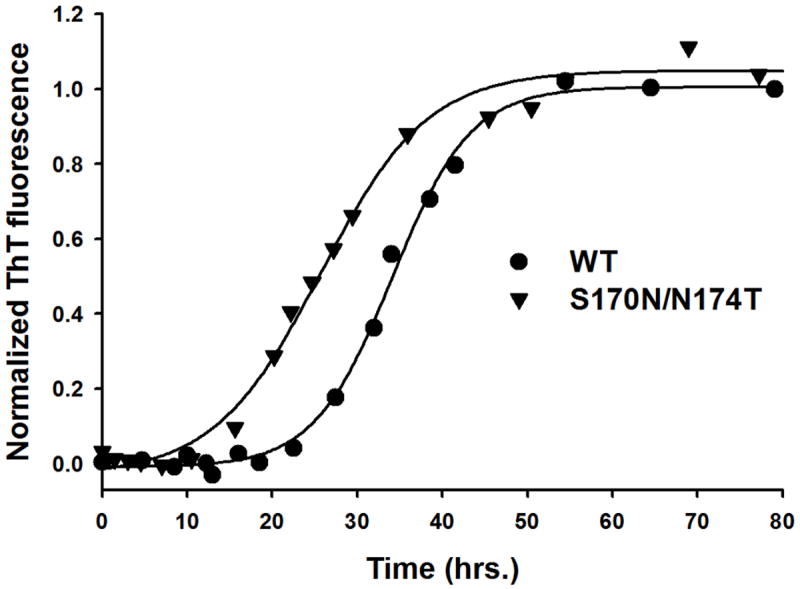
Fig 5.

Time-course of amyloid fibril formation for wild type moPrP and S170N/N174T moPrP under fully denaturing conditions. Experiments were performed in the presence of 4 M GuHCl. Solid lines show best fits to equation [1]. The lag phases are 22.5 ± 2.5 h and 13.8 ± 2.0 h for wild type moPrP and S170N/N174T moPrP respectively. The lag phases were determined by fitting individual ThT response curves to equation [1], and these individual values from 3-4 experiments were used to calculate the mean value and associated standard errors.
