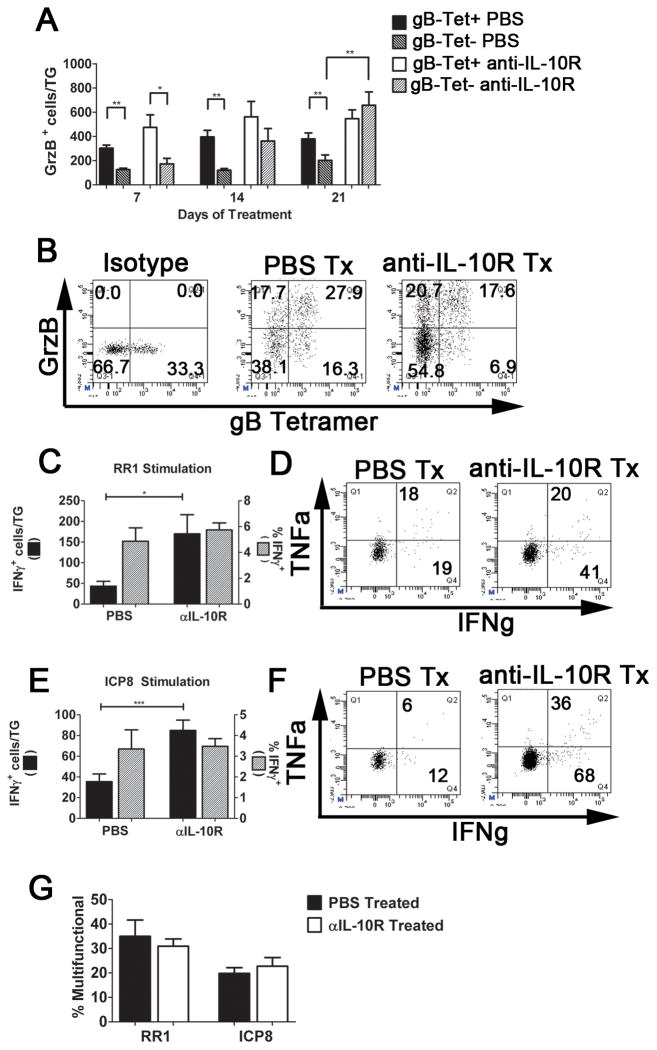
Figure 4. Blocking IL-10 signaling during latency increases the number of functional subdominant CD8+ T cells in TG.
Latently infected mice were treated with PBS or anti-IL-10R mAb for 7–21 days (A&B), or 14 days (C-G). (A&B)After treatment, TG cells were stained for CD8α, granzyme B (GrzB), and with gB498-505 tetramers (gB-Tet), and analyzed by flow cytometry. Bars represent the cumulative mean ± SEM number of GrzB+ cells (PBS: 2 experiments, total n = 6 mice/time; anti-IL-10R: at least 2 experiments, total n = 5, 12, and 17 mice at 7, 14, and 17 days, respectively. (B) Representative dot plots gated on CD8+ T cells showing GrzB expression in gB-Tet+ and gB-Tet- cells in TG after 21 days of PBS or anti-IL-10R treatment. (C-G) After treatment, TG cells were incubated for 6 hours with B6WT3 fibroblasts pulsed with three RRI epitopes (C, D, & G) or three ICP8 epitopes (E-G). Cells were analyzed for surface CD8α and intracellular IFNγ (C&E), or surface CD8α and CD107a and intracellular IFN-γ and TNFα (D, F, & G) and analyzed by flow cytometry. (C&E)Bars represent cumulative mean ± SEM number (black bar) or frequency (gray bar) IFN-γ+ cells/TG (3 experiments, n = 11 mice). (D&F) Representative dot plots displaying IFN-γ and TNFα production after stimulation with RR1 peptides (D) or ICP8 peptides (F). Numbers indicate the cells numbers for the denoted quadrants. (G) Bars represent cumulative mean ± SEM percentage multifunctional (IFN γ+, TNFα+, and CD107a+) CD8+ T cells (3 experiments, total n = 7–12 mice). Statistical significance was determined using unpaired Student’s T test. * p ≤ 0.05, ** p ≤ 0.005, *** p ≤ 0.0005.

