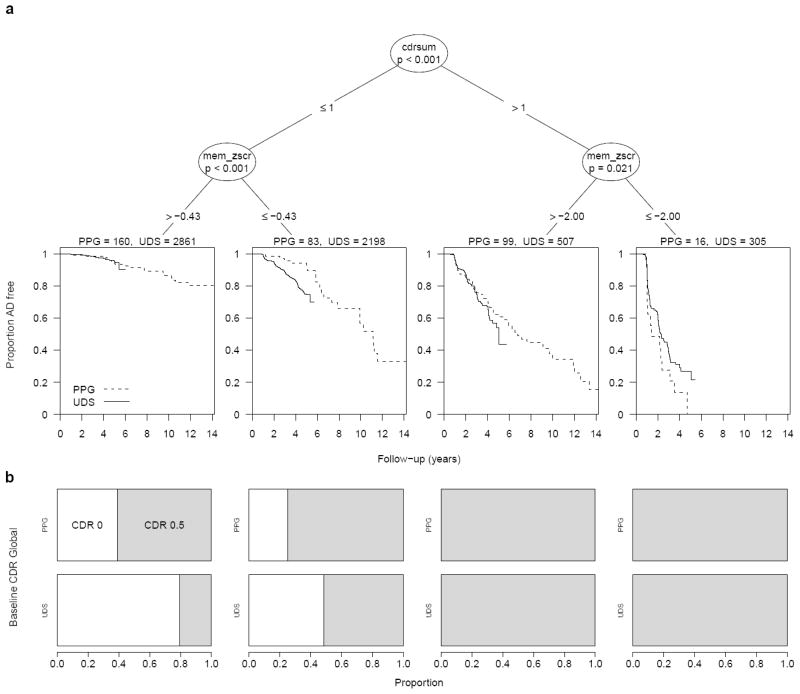
Figure 1.
(A) Baseline risk stratification of the PPG cohort using shared baseline variables. Terminal nodes overlay Kaplan-Meier survival curves for freedom from probable AD for the PPG cohort (dashed line) and for the NACC-UDS validation cohort (solid line). (B) The distribution of CDR Global scores at baseline (0 = white, 0.5 = shaded) in the PPG and NACC-UDS cohorts for each of the four risk strata defined by the shared-variable survival tree model.

