
Fig. 4.
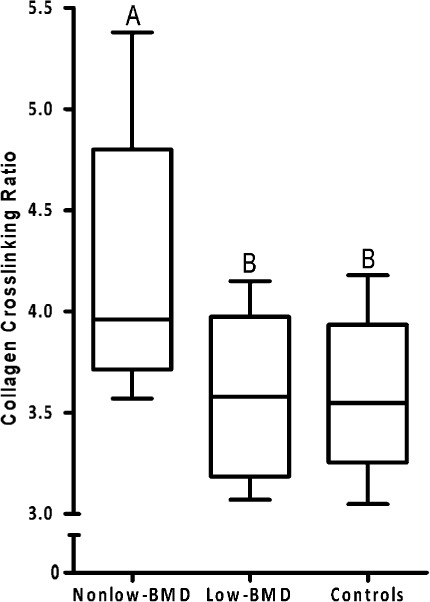
Box plots of the collagen crosslinking ratio in bone from subjects with non-low BMD (t-score > −2.0) and low-energy fractures, subjects with low BMD (t-score ≤ −2.5) and low-energy fractures, and healthy volunteers (controls). Box plots labeled with the same letters do not differ significantly. The bottom and top of the box represent the interquartile range (25% to 75%), the line within the box denotes the median (50%), and the upper and lower bounds of the error bars denote the range.