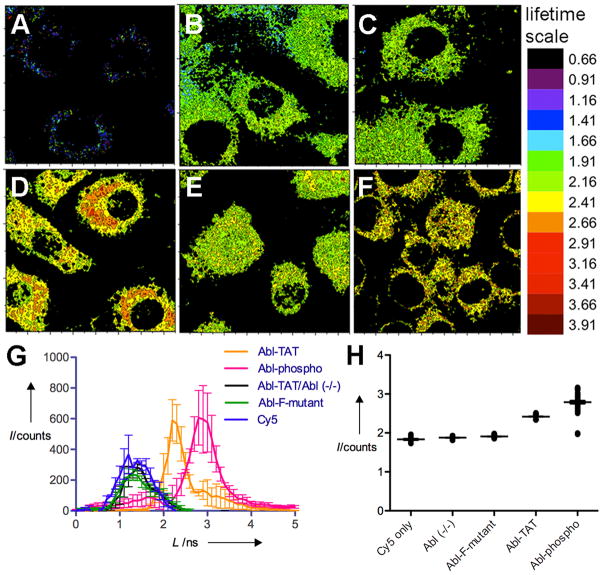
Figure 3. FLIM mapping of biosensor phosphorylation.
WT MEF cells (unless otherwise indicated) were cultured on cover slips and incubated with the biosensor peptide or a control (as indicated, 50 nM for each) for 24 h, then imaged using the FLIM system. Data were extracted from raw FLIM images and represented as lifetime maps A–F: (A) autofluorescence, (B) Cy5 only, (C) Abl-TAT in Abl (−/−) MEFs, (D) Abl-TAT in WT MEFs, (E) Abl-F-mutant, (F) Abl-phospho. Full color scale for the lifetime range is shown at right. Raw FLIM images and lifetime color maps with intensity indicated on the z-axis are shown in Figure S2. (G) Fluorophore lifetime per cell was averaged for at least 20 cells in 3–5 replicate experiments and is plotted as a distribution of lifetimes observed in each condition. Error bars represent standard error of the mean for each lifetime value. H) Aligned scatter plots of lifetimes for pixels in selected regions of interest (ROIs) within similar subcellular locations for cells represented in G. I = intensity, L = lifetime. Error bars represent SEM.

