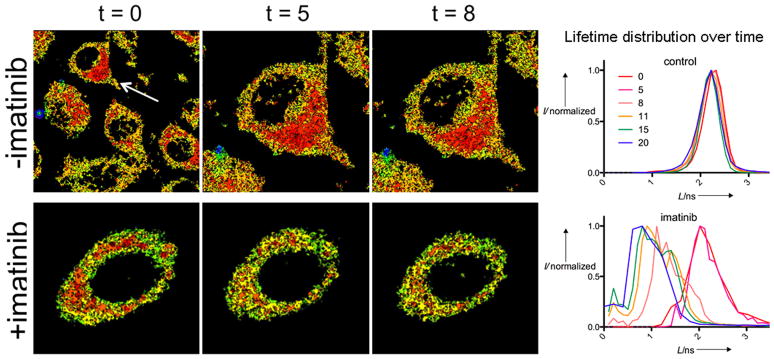
Figure 4. Subcellular Abl inhibition by imatinib.

MEFs were treated with the biosensor and imaged before (t = 0) or after (t = 5, 8 min) adding the Abl inhibitor imatinib. Arrow shows selected control cell (top panels). B) Plot of lifetime distribution for cells shown as well as longer timepoints (0–20 min). Additional timepoint images, and plots for several subcellular ROIs for multiple cells, are shown in the supporting information.
