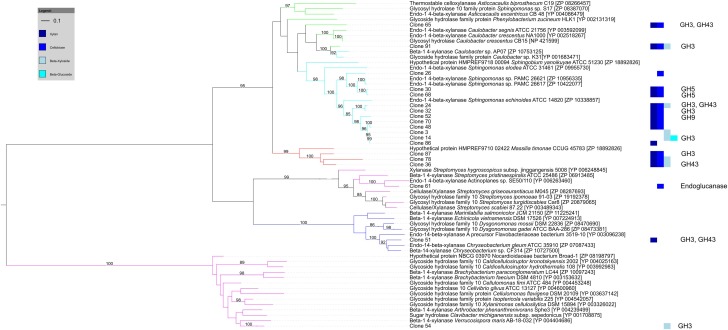
Figure 4.
Maximum likelihood tree of GH10 endo-β-1,4-xylanases identified from cellulose and hemicellulose hydrolyzing fosmid clones. Clone numbers indicate clones from which the GH10 genes were identified and refer to Table S3. The screening substrates that the clones were active on are indicated by bar colors (Dark blue: AZCL Xylan; medium blue: MUB-β-D-Cellobiose; cyan: 4-MUB-β-D-Xyloside; Light blue: PNP-β-D-glucopyranoside). Additional GH genes identified by homology-based annotation from the respective clones are shown on the right. Branches are colored by tetranucleotide frequency bin (Green and cyan: Bins 7 and 10, α-proteobacteria; Red: Bin 8, β-proteobacteria; Blue: Bin 5, Bacteroidetes; Magenta: Bin 1, Actinobacteria). Bootstrap percentages from 100 permutations higher than 80% are shown at branches. The scale bar represents the number of amino acid substitutions.

