Figure 7.
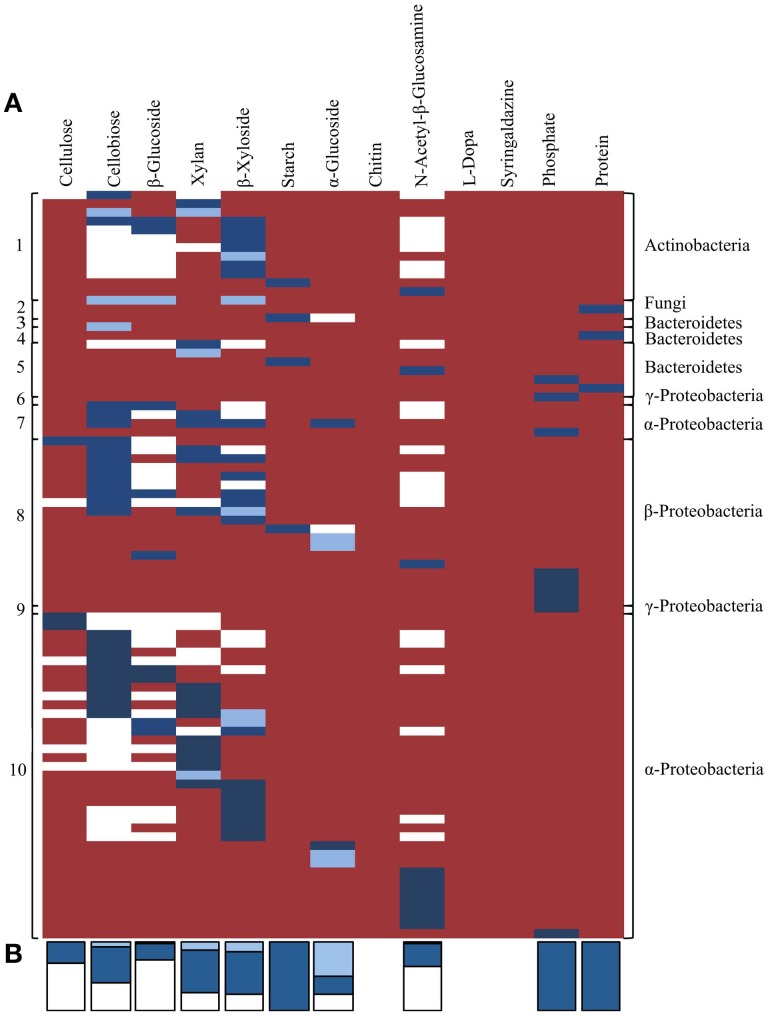
(A) Co-occurrence of traits related to plant polymer decomposition within tetranucleotide frequency bins, derived by either in silico predicted and/or activity-based screens. Each row represents an individual sequenced fosmid with biochemically confirmed activity against one or more substrates. White shading indicates activities predicted by in silico annotation only. Light blue shading indicates activities that were biochemically confirmed using functional screening but not predicted by in silico annotation. Dark blue shading indicates activities predicted by in silico annotation and biochemically-confirmed by functional screening. Red shading indicates no predicted or observed activity. Numbers on the left correspond to TNF bins in Figure 5. (B) Stacked bars at the bottom indicate the proportion of activities for each substrate predicted by homology-based in silico annotation and/or functional screening. Colors correspond to panel (A).

