Figure 4.
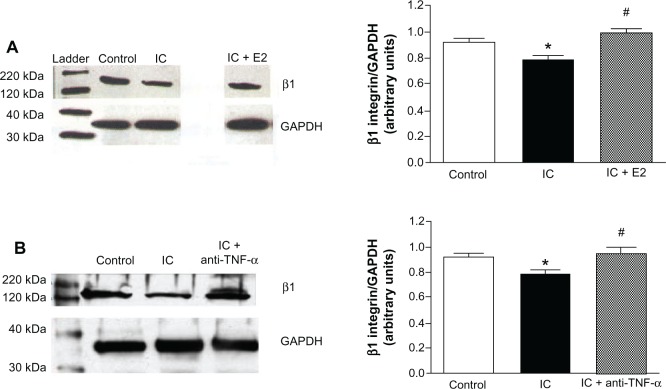
(A) Western blot example and bar graph of β 1 integrin levels from isolated cardiac fibroblasts cocultured with cardiac inflammatory cells (IC) and estrogen-treated inflammatory cells (IC + E2). (B) Western blot example and bar graph of β1 integrin levels from isolated cardiac fibroblasts cocultured with cardiac inflammatory cells (IC) and cardiac inflammatory cells in the presence of a neutralizing antibody against TNF-α (IC + anti-TNF-α). *P < 0.05 versus control; *P < 0.05 versus IC.
Abbreviations: TNF-α, tumor necrosis factor-alpha; GAPDH, glyceraldehyde 3-phosphate dehydrogenase.

