
Figure 6.
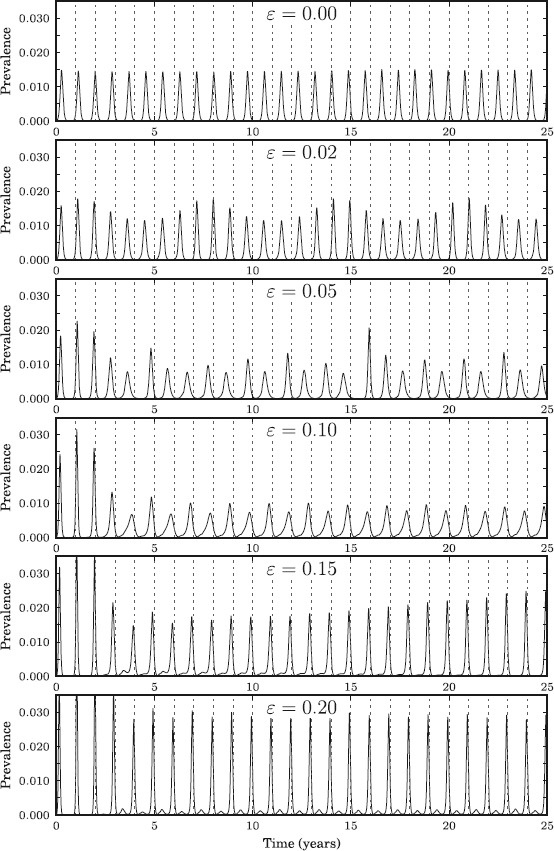
Prevalence (measured in percentage of the population infected per day) for different values of non-negative ε, i.e. for the tropics and the northern hemisphere. The dashed vertical lines represent the middle of the winter of each year.
Official websites use .gov
A
.gov website belongs to an official
government organization in the United States.
Secure .gov websites use HTTPS
A lock (
) or https:// means you've safely
connected to the .gov website. Share sensitive
information only on official, secure websites.
Prevalence (measured in percentage of the population infected per day) for different values of non-negative ε, i.e. for the tropics and the northern hemisphere. The dashed vertical lines represent the middle of the winter of each year.