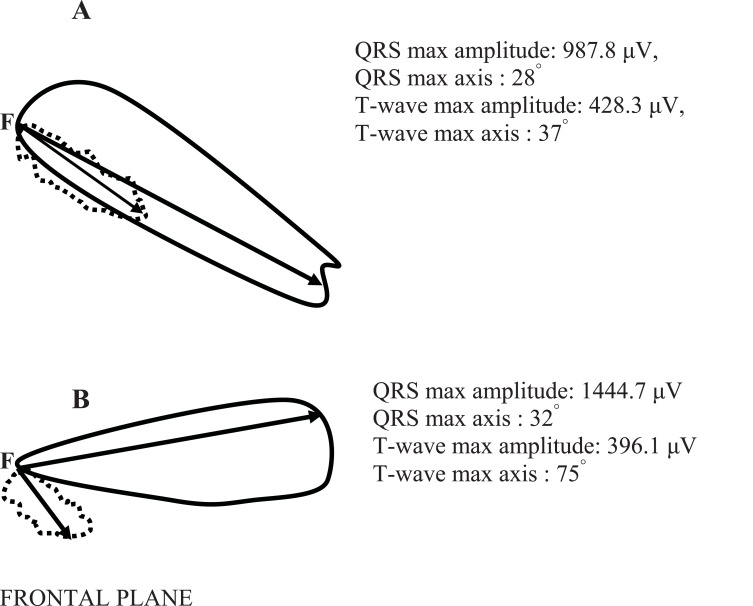
Fig. (2).
The vectorcardiograms of a healthy subject (A) and of a subject with type 2 diabetes mellitus and hypertension (B) in the frontal plane. The continuous line depicts the loop of the QRS-complex and the dashed line the loop of the T-wave in the frontal plane. On the right corner the max values of the QRS and T-wave vector loops amplitude are shown (calculated in μV). Moreover, the max values of the QRS and T-wave axis in the frontal plane are shown (calculated in degrees). The spatial QRS-T angle (the angle between the two arrows) in the case (A) is 1.55 degrees and in the case (B) is 57.31 degrees.

