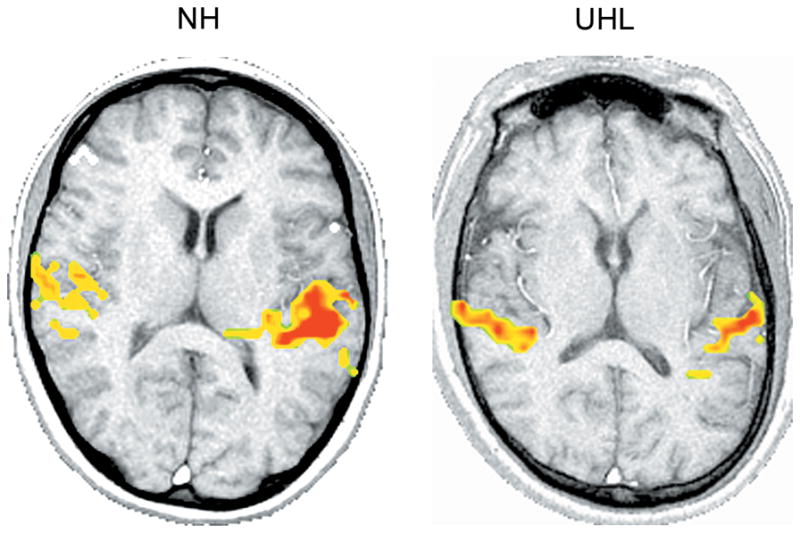
Figure 5.

Comparison of a normal hearing (NH) (left image) and unilateral hearing loss (UHL) (right image) subject. Speech stimulus/ba/is presented at 80 dB HL in the right ear of both subjects. The UHL subject has normal hearing thresholds in the right ear and profound hearing loss in the left ear. Axial slices shown in radiological orientation (right hemisphere to the left, left hemisphere to the right). The NH subject shows greater asymmetry between hemispheres compared to the UHL subject for whom activation is more balanced.
