
Fig. 3.
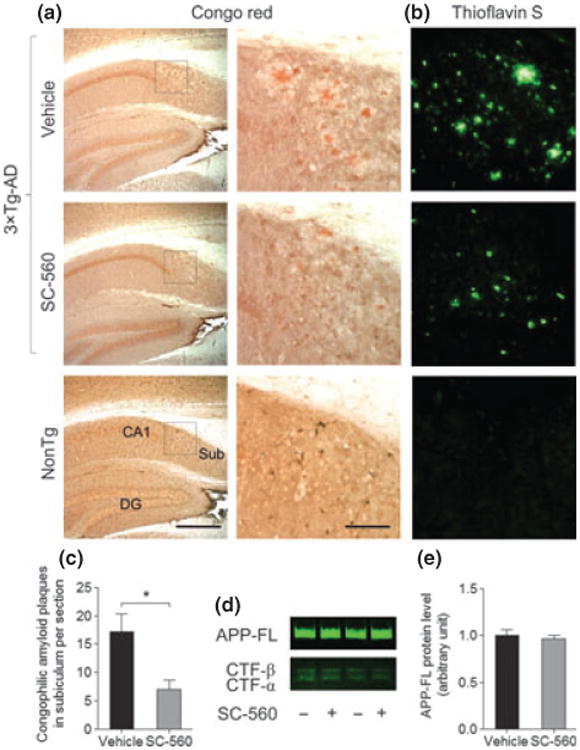
SC-560 treatment reduces amyloid deposits. (a, b) Representative images of Congo red (a) and thioflavin S staining (b) in hippocampal subiculum in 3 × Tg-AD mice treated with vehicle or SC-560. Scale bar, 100 μm. Boxed regions (left) indicate the areas magnified (right), respectively. (c) Quantification of Congophilic amyloid deposits in the subiculum. Data are means ± SEM (n = 6 per group). *p < 0.05 versus vehicle-treated 3 × Tg-AD mice. (d) Representative western blot of full-length APP (APP-FL) and APP C-terminal fragments (CTFs) in the brain homogenates of 3 × Tg-AD mice treated with vehicle or SC-560. (e) Quantification of APP-FL expres-sion. Data shown are the means ± SEM (n = 6 mice per group).