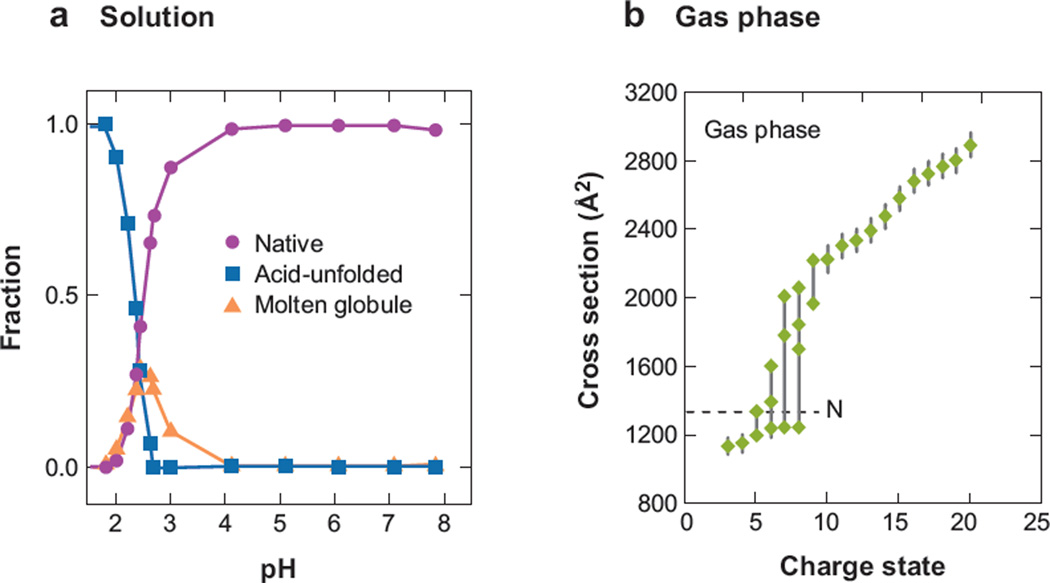
Figure 1.
(a) The relative abundances of three ensembles of structures (native, acid-unfolded, and molten globule) observed by Soret absorption analysis of the acid denaturation of cytochrome c in water. (b) The collision cross sections for the most intense features observed as a function of charge state for protonated cytochrome c in the gas phase. The dotted line denotes the cross section of the native state at 1334 Å2. Figure 1a reprinted from Reference 79. Copyright American Chemical Society 1993. The value for the dotted line in Figure 1b comes from Reference 88.

