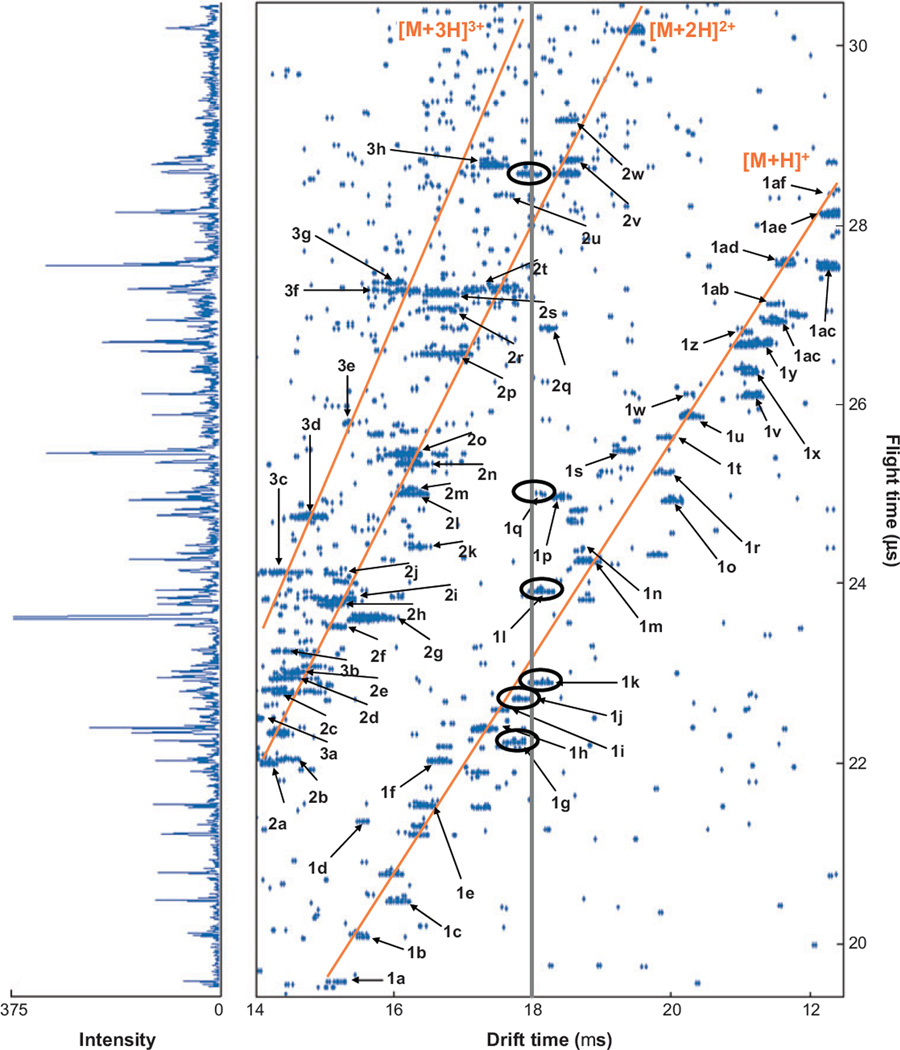
Figure 3.
Nested td (tf) distribution for the direct infusion of a mixture of ions produced by electrospray of a tryptic peptide mixture from the digestion of dog and pig hemoglobin, bovine and pig albumin, and horse cytochrome c. The solid lines in the two-dimensional plot indicate the positions of the [M + H]+, [M + 2H]2+, and [M + 3H]3+ charge-state families. The vertical line at 18 ms highlights the overlap of different m/z species within the mobility distribution; several of the ions having drift times similar to this value are circled. The numbers and letters label peaks and correspond to the assignments given in table 1 of Reference 25. On the left is a mass spectrum obtained by summing the intensities at a given flight time across all drift time windows. These data were acquired using a drift field of 171.7 V cm−1 with a 300-K helium pressure of 150.3 torr. The data were acquired in ~100 min. Figure adapted from Reference 25.

