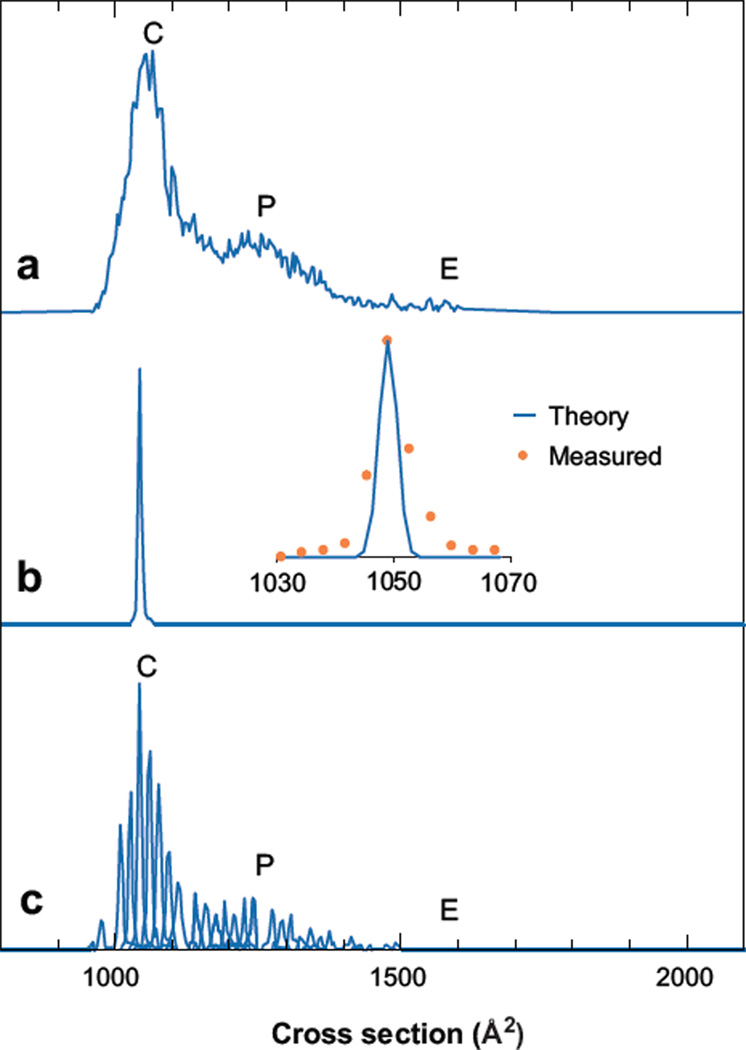
Figure 5.
Drift time distributions of the [M + 7H]7+ of ubiquitin. (a) The total mobility distribution shows that the +7 charge state exists mostly as compact structures (C), some partially folded structures (P), and minimal elongated structures (E). (b) A single peak is observed when a narrow distribution (50 µs) of the compact structure is isolated with mobility selection at 7.8 ms. The inset compares the theoretical to the experimentally measured peak shape. (c) The total mobility distribution for the +7 charge state is reconstructed with 28 mobility-selected distributions acquired every ~0.125 ms. This demonstrates that this distribution arises from many overlapping structures that are stable over the course of the two-dimensional acquisition. Figure reprinted from Reference 52.

