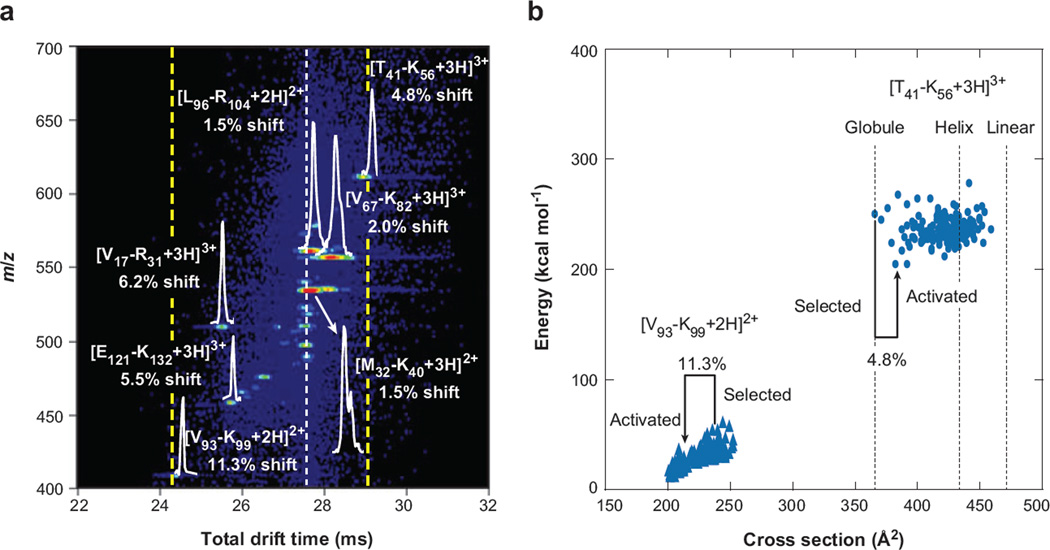
Figure 7.
(a) An expanded view of an activated selection of human hemoglobin tryptic peptides. The white dotted line denotes the time at which mobility-selected ions with no activation are observed, whereas the dashed yellow lines show the new effective separation space of the second ion mobility spectrometry experiment. Drift distributions for several peptides are shown, along with shifts from original (inactivated) drift times for all ions. (b) Energy versus conformer cross section of the 150 lowest-energy structures post–simulated annealing for two peptides from panel a ([V93 − K99 + 2H]2+ and [T41 − K56 + 3H]3+) as well as cross sections of the energy-minimized structures of the [T41 − K56 + 3H]3+ ion modeled as a helix and linear structure, denoting the range of structures available to each sequence. Cross sections of the selected and activated structures for each sequence are highlighted, along with percent shifts from the mobility-selected structure. Note that the nomenclature used refers to the position of the peptide by providing the location (with respect to the intact protein sequence) and single letter abbreviation of the N- and C-terminal residues, respectively. Figure reprinted from Reference 55.

