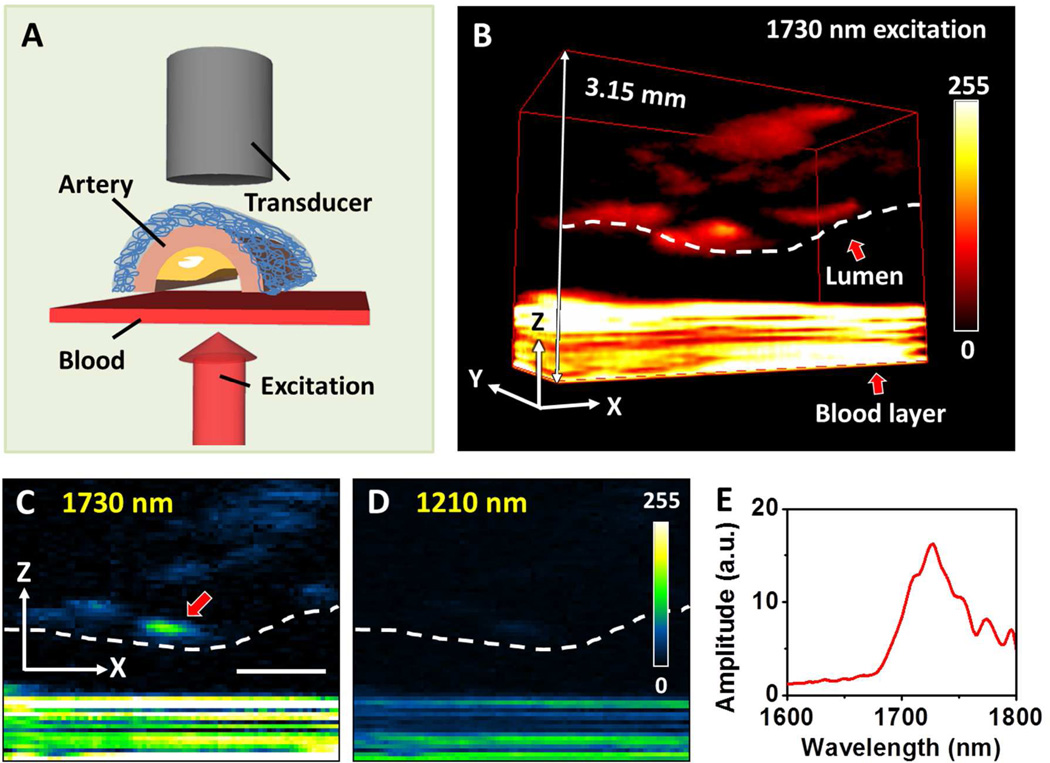
Figure 6. PA imaging and spectroscopy of arterial plaque in the presence of blood.
(A) Schematic for PA imaging of an artery through whole blood. (B) 3D imaging of arterial plaque by 1730 nm excitation. Lumen and blood are indicated with red arrows. To precisely control the thickness at 0.5 mm, the blood was sandwiched between two cover glasses. As the result, the ultrasound signal from the blood layer was reflected by the glasses for multiple times, which generated an interference pattern of the signal from blood. (C) PA image at selected x–z plane under 1730 nm excitation. (D) PA image at selected x–z plane under 1210 nm excitation. (E) PA spectrum taken at the lipid deposition pointed by red arrow in (C). Scale bar: 1 mm. Adapted from Wang et al, J Biophotonics (2012).

