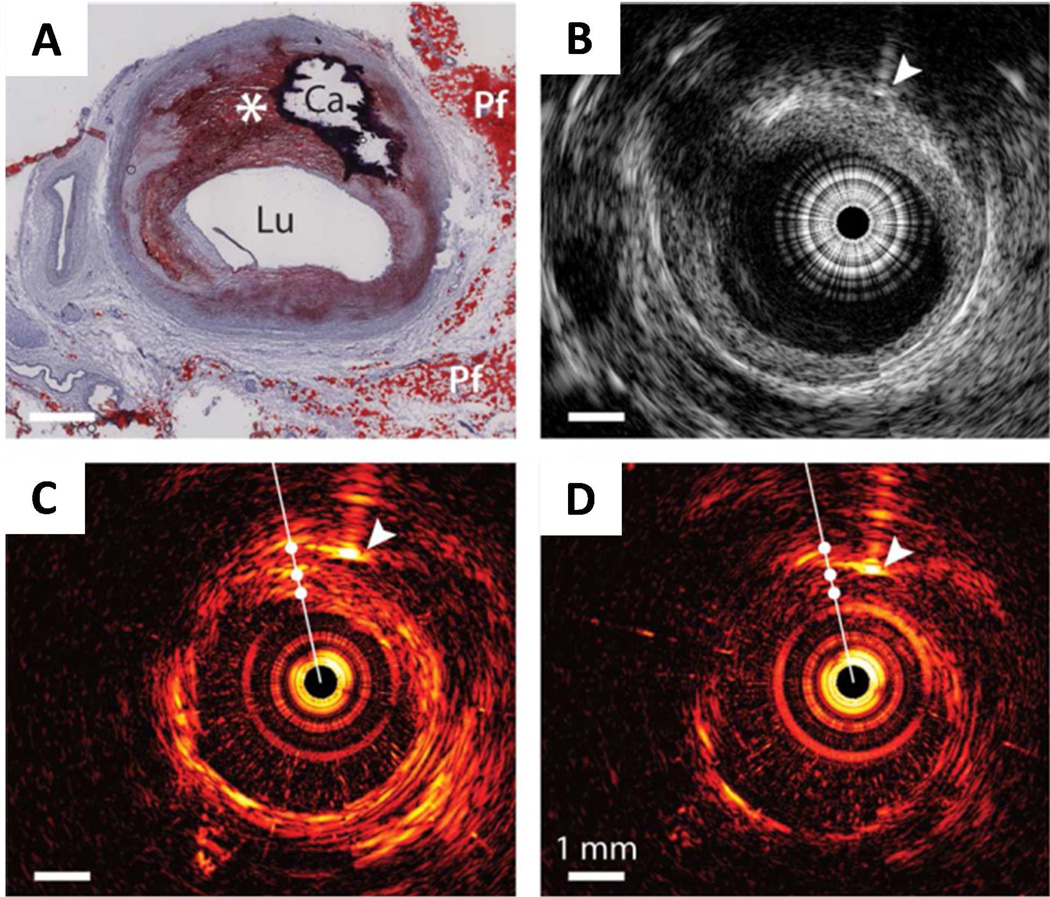
Figure 7. IVPA/IVUS imaging of an advanced human atherosclerotic plaque.

(A) Histology: Oil Red O stain shows the presence of a lipid-rich plaque (*) as well as a calcified area (Ca). Lu, lumen; Pf, peri-adventitial fat. (B) IVUS image, IVPA images at (C) 1210nm (high lipid absorption) and (D) 1230nm (low lipid absorption). Arrowheads indicate the needle used for marking. Adapted from Jansen et al, Opt. Lett. (2011).
