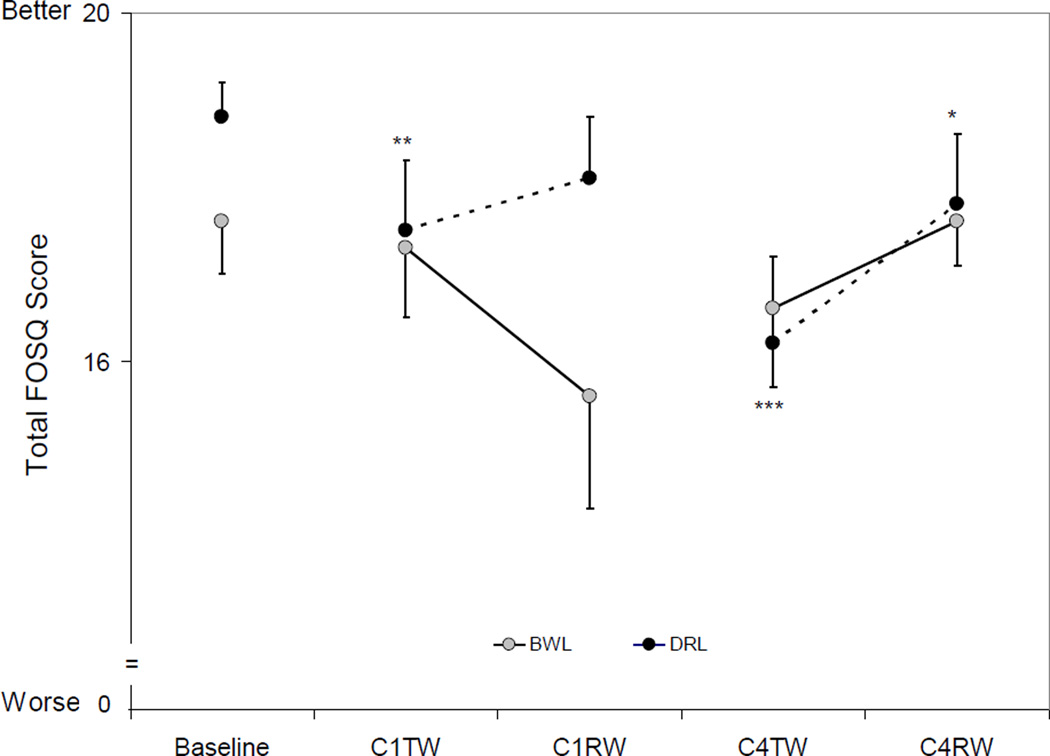
Figure 3. Total FOSQ scores by group and time.
Total FACT-B Scores (mean ± SEM) at Baseline and During Chemotherapy. The error bars are depicted as being one tailed to avoid overlap across measures. There was an overall time effect for the DRL group (p=0.001) but not for the BWL group. Compared to baseline, total FACT-B scores decreased significantly at C1TW and C4TW in the DRL group while no significant changes in the BWL group. Compared to baseline: ** p<0.01.

