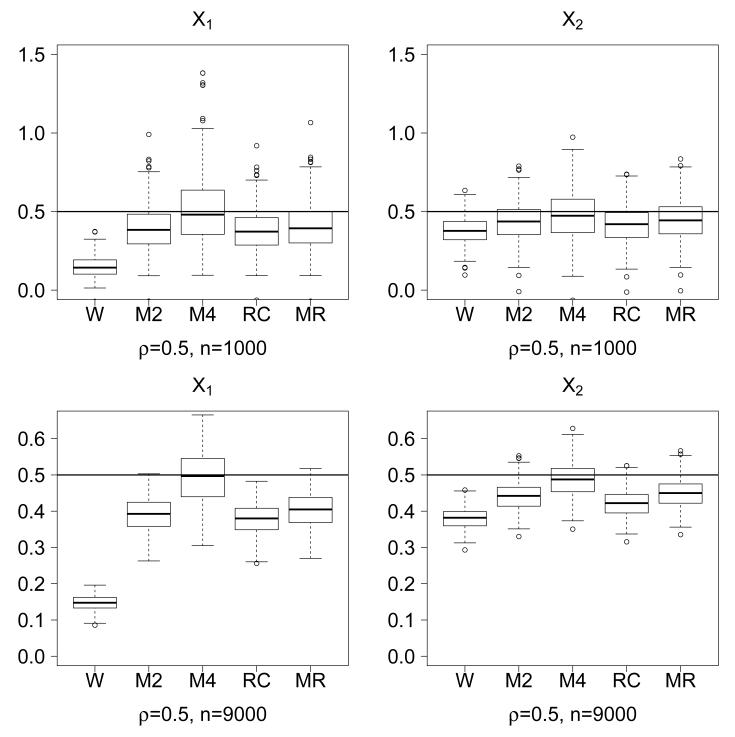
Figure 2.
Boxplots of from B = 250 simulated data sets, for chi-square X1 and X2 and P(Y = 1|X1, X2) = F(β0 + β1X1 + β2X2), with true values β=(β0, β1, β2) =(1.5, 0.5, 0.5) denoted by a horizontal line. Reliability ratios for X1 and X2 are 0.50 and 0.75, respectively, ρ = 0.50 and n = 1000 or n = 9000. Method: W, naive; M2 and M4, multivariate MAI with M=2 and 4, respectively; RC, regression calibration; MR, moment reconstruction.

