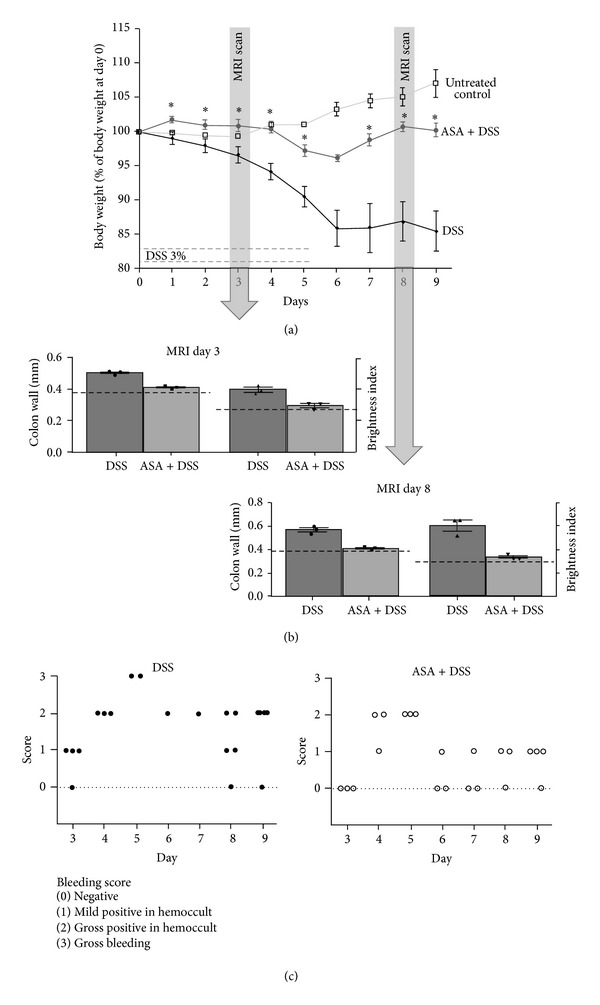
Figure 2.

In vivo assessment of colitis severity. (a) Body weight course in the different groups, n = 3 for the control group, n = 5 for the ASA-group, and n = 6 for the DSS group; *P < 0.05 versus DSS. (b) MRI-measured colon wall thickness and brightness on day 3 as well as day 8 of the experimental protocol, n = 3 for each treatment group. In dashed lines, the values of measurements in untreated control mice are shown. (c) Bleeding score evaluation in animals treated with DSS or ASA + DSS. There was no bleeding in control animals (not shown).
