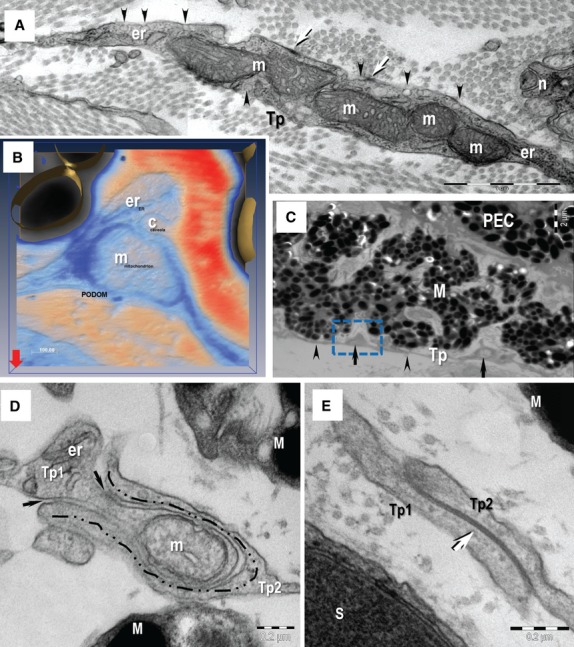
Fig. 5.

Transmission electron microscopy (TEM) image of the telopodes (Tp). (A) The Tp present small dilatation named podoms. The podoms accommodates mitochondria (m) and endoplasmic reticulum cisternae (er). Caveolae (arrowheads) and focal adhesion (arrows) are visible on the cellular membrane of telocyte at the podom level. n – nerve. (B) Electron tomography (3D isosurface reconstruction) of a podom illustrate the ‘Ca2+-uptake/release unit’ formed by mitochondrion (m), endoplasmic reticulum (er) and caveolae (c). (C) Rectangular mark indicates the podom on which electron tomography was performed on a thick section (200 nm). The Tp present alternating thin segments (podomeres, arrowheads) and small dilatation (podoms, arrows). (D, E) TEM images show different types of homocellular junctions connecting the telopodes (Tp1, Tp2): manubria adhaerentia (dashed line in B), puncta adhaerentia (black arrows in B) and gap junction (white arrow in C). M: melanocyte; S: Schwann cell; scale bars: A – 1 μm; B – 0.1 μm; C – 2 μm; D, E – 0.2 μm.
