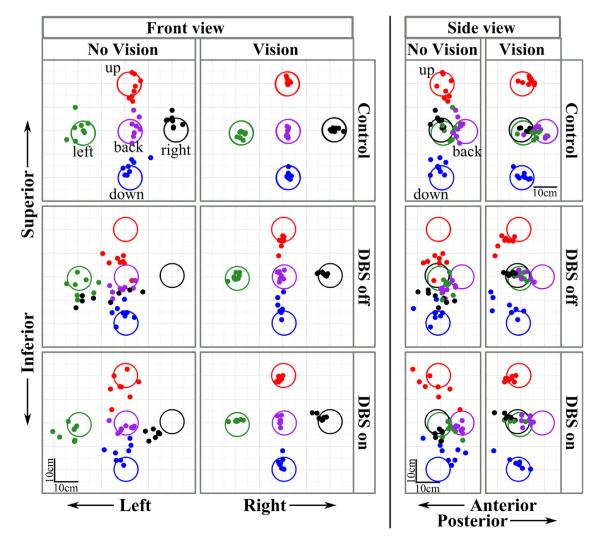
Fig. 3.
Endpoint distributions of a representative control subject (top row) and a PD patient when STN DBS was switched off (middle row) and switched on (bottom row). Both front and side views are shown. Within each view, the no vision condition is on the left (first and third columns) and the vision condition is on the right (second and fourth columns). The large (10-cm diameter) circles represent the five targets with unique colors, and filled dots are individual trial endpoints with matching colors. Target size is enlarged for clarity. Scale bar = 10 cm. Note the markedly increased localization errors of the PD patient, particularly when vision was occluded and when STN DBS was switched off.

