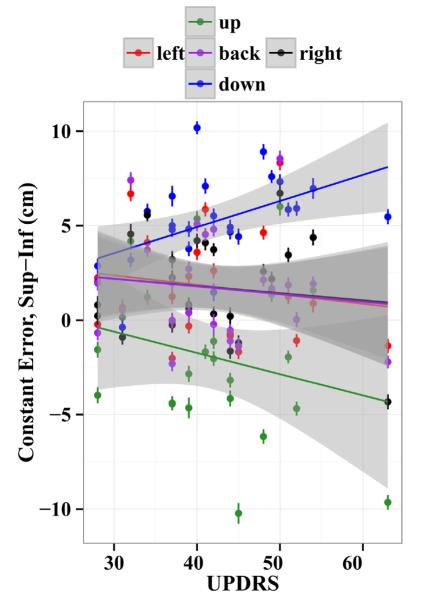
Fig. 6.
Constant error in the superior–inferior direction to each of the five targets separately for all subjects with STN DBS On and Off. Positive values are upward. Error lines represent standard errors over trials, the line is a least square fit within each target, and the shaded region represents 95% confidence of the fit. Constant error in the superior–inferior direction for the three targets at central height (left, back and right) show very little variability across UPDRS. However, the upper target shows an increasing downward deflection and the lower an increasing upward deflection with increasing UPDRS scores.

