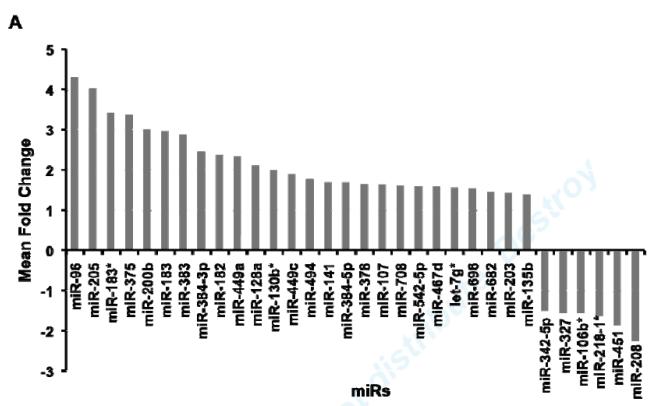
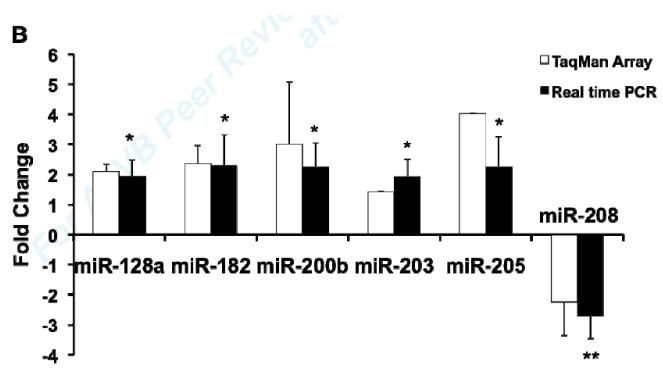
Fig1. MiR expression profilling analysis in mouse aorta.
(A) Significantly differentially expressed miRs in E2-treated mouse aortas. Relative quantification of miR expression was calculated by the 2−ΔΔCt method. Data normalization was done using snoRNA202 as the endogenous control and ath-miR159a as the negative control. Results were shown as mean fold change (MFC) of two independent experiments. (B) Validation of E2-regulated miRs in mouse aorta. 10 miRs were selected from microarray data for qRT-PCR validation. Data were normalized with the vehicle-treated controls. Results were shown as mean ± S.D. of four independent experiments. *P<0.05, **P<0.01, refer to a comparison between E2- and vehicle-treated samples for qRT-PCR.


