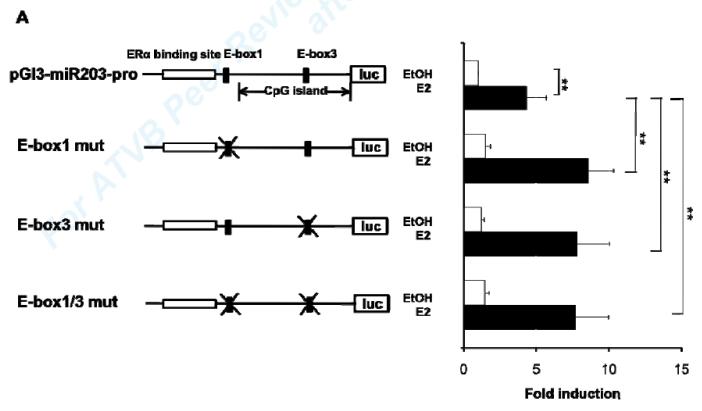
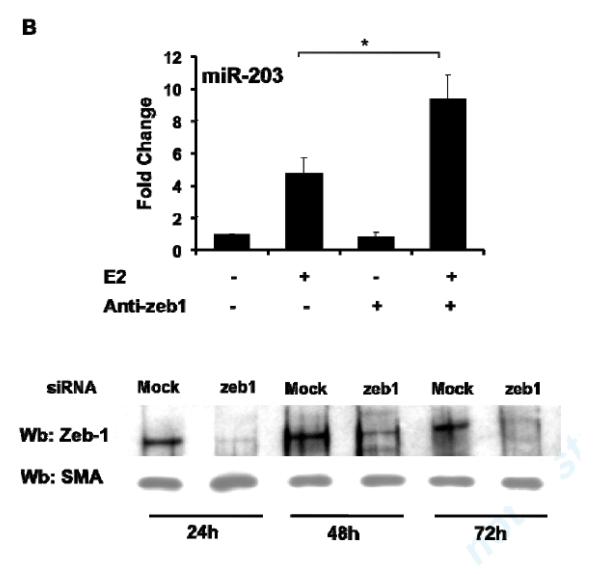
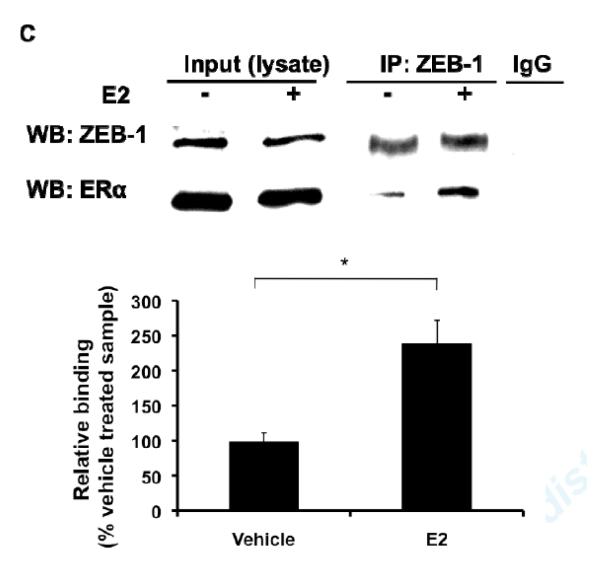
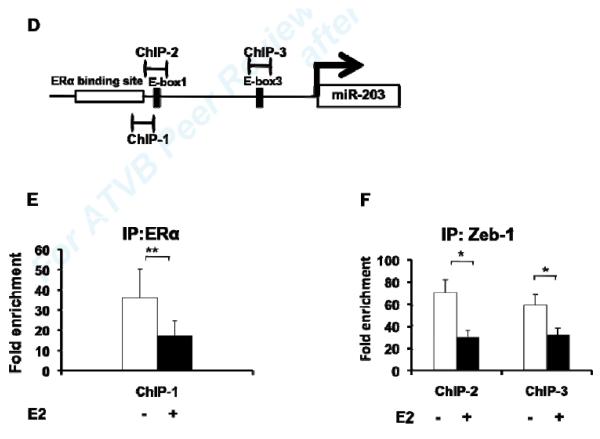
Fig5. Zeb-1 is involved in E2 regulation of miR-203 expression in MAoSMCs.
(A) Mutations of single or double E-Boxes 1 and 3 resulted in significantly increased E2 induction of transcriptional activation of the miR-203 promoter. Values shown are mean ± SD of seven independent experiments. (B) Inhibition of Zeb-1 expression by introducing siRNA in MAoSMCs enhanced E2 induction of miR-203 gene expression. Values shown are mean ± SD of three independent experiments. Immunoblots in the lower panel show Zeb-1 expression was significantly reduced 24h, 48h, and 72h after transfection of siRNA. (C) Co-immunoprecipitation of endogenous Zeb-1 and ectopically expressed flag-tagged ERα in MAoSMCs. MAoSMCs were infected with Ad-ERα and treated with E2 for 24h. Immunoprecipitation was performed with Zeb-1 and western blotting was performed with a monoclonal anti-Flag antibody to detect the co-immunoprecipitated ERα protein. One-twentieth of the input cell lysate were loaded in the first two panels and blotted for the presence of Zeb-1 and ERα. Representative data of three independent experiments are shown. Densitometric analysis of gel lanes was performed using AlphaImager Gel Imaging System (Alpha Innotech). Data were corrected both for the ERα input and Zeb-1 pull down. (D) The locations of three primer pairs used for the ChIP analysis (ChIP-1, ChIP-2, and ChIP-3) are depicted. Arrow represents transcription start site of miR-203 gene. (E,F) ChIP analysis of the miR-203 locus in MAoSMCs. Cells were infected with Ad-ERα and treated with E2 for 24 h. Cross-linked chromatin was immunoprecipitaed with antibodies specific for the mouse ERα or Zeb-1. Purified DNA was amplified with the three ChIP primer pairs shown in Fig 5D. Results are shown as fold enrichment over an intergenic region serving as negative control. Values shown are mean ± SD of at least four independent experiments. *P<0.05, **P<0.01.


