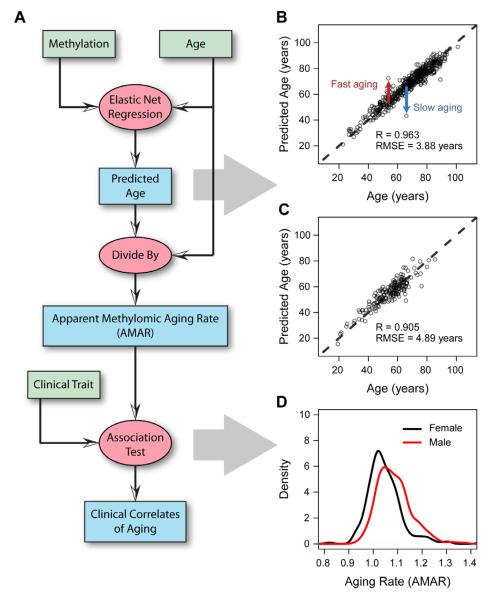
Figure 2. Model predictions and clinical variables.
(A) A flow chart of the data (green boxes) and analyses (red ovals) used to generate aging predictions (blue boxes). (B) A comparision of predicted and actual ages for all individuals based on the aging model. (C) Out-of-sample predictions for individuals in the validation cohort. (D) Apparent methylomic aging rate (AMAR) for each individual, based on the aging model without clinical variables. The distribution of aging rates shows faster aging for men than women. A table of the markers used in the aging model are provided as Table S3.

