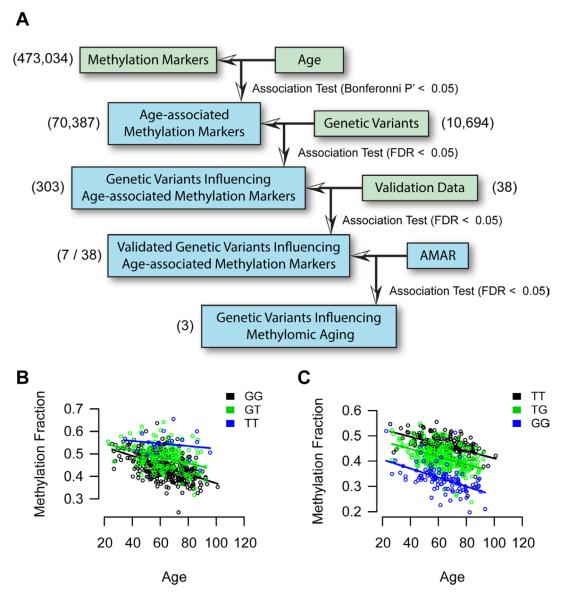
Figure 3. Genetic effects on methylomic aging.
(A) We surveyed genomic variants for an association with age-associated methylation markers. 8 genetic variants, corresponding to 14 meQTLs, were chosen for validation. Of these, 7 were significant in the validation cohort and two showed an association with AMAR. (B) A plot of the trend between the methylation marker cg27367526 (STEAP2) and age. The state of variant rs42663 (GTPBP10) causes an offset in this relationship. (C) A second example for cg18404041 and rs2230534 (ITIH1, NEK4). A table of confirmed genetic associations is provided as Table S4.

