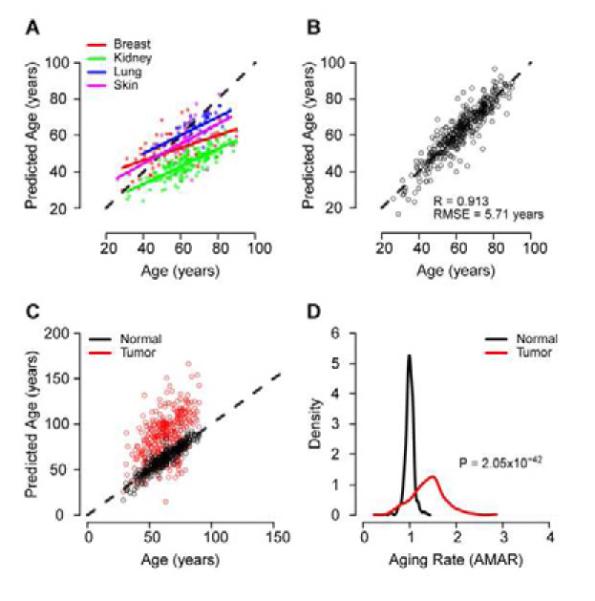
Figure 4. Multi-tissue support.

(A) Predictions of age made by the full aging model on the TCGA control samples. There is a high correlation between chronological and predicted age, but each tissue has a different linear intercept and slope. (B) After adjusting the intercept and slope of each tissue, the error of the model is similar to that of the original whole blood data. Age predictions made on cancer samples are presented as Figure S2. (C) Age predictions made on matched normal and tumor samples from TCGA. Predictions are adjusted for the linear offset of the parent tissue (breast, kidney, lung, skin). (D) Tumor samples show a significant increase in AMAR.
