
Figure 7. Transcription aging model.
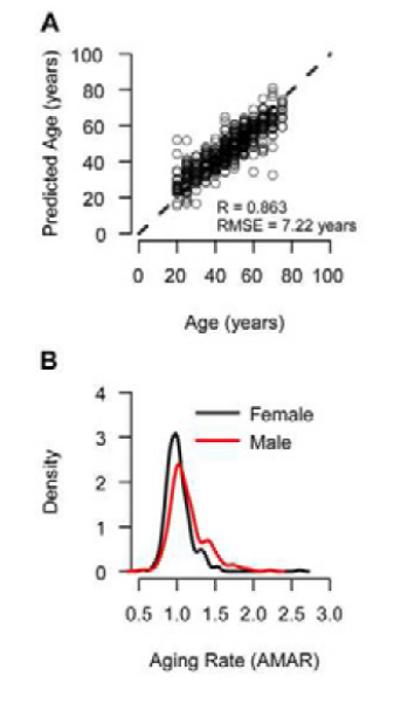
(A) We built an aging model using mRNA expression data for genes which showed an aging trend in the methylome. It’s standard error (RMSE = 7.22 years) is increased due to the rounding of ages to the nearest five-year interval in the dataset. (B) Similar to the methylome, the transcriptome shows an increased aging rate for men as compared to women (P < 10−4).