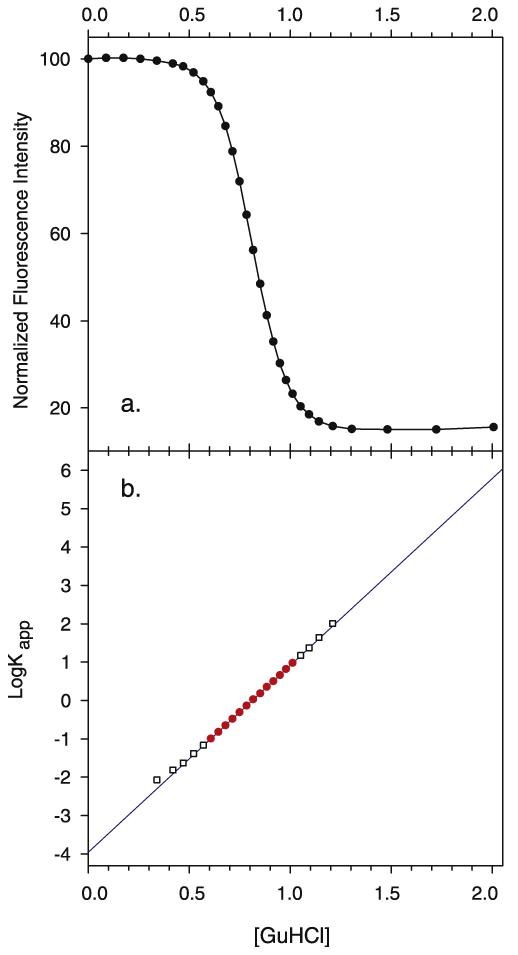
Fig. 1.
Experimental denaturation of wild-type staphylococcal nuclease followed by tryptophan fluorescence. (a) A representative sample plot of the fluorescence of tryptophan 140 versus guanidine hydrochloride concentration. The intensity at zero molar guanidine hydrochloride is assigned the arbitrary value of 100 and all subsequent fluorescence values are normalized to it. (b) Plot of log Kapp versus the concentration of guanidine hydrochloride. The solid line is the least square fit of log Kapp versus [GuHCl] in the region where 1 > log Kapp > −1. Experimental data points used in the regression are shown by filled circles. Outside this region they are hollow squares.

