
Figure 2.
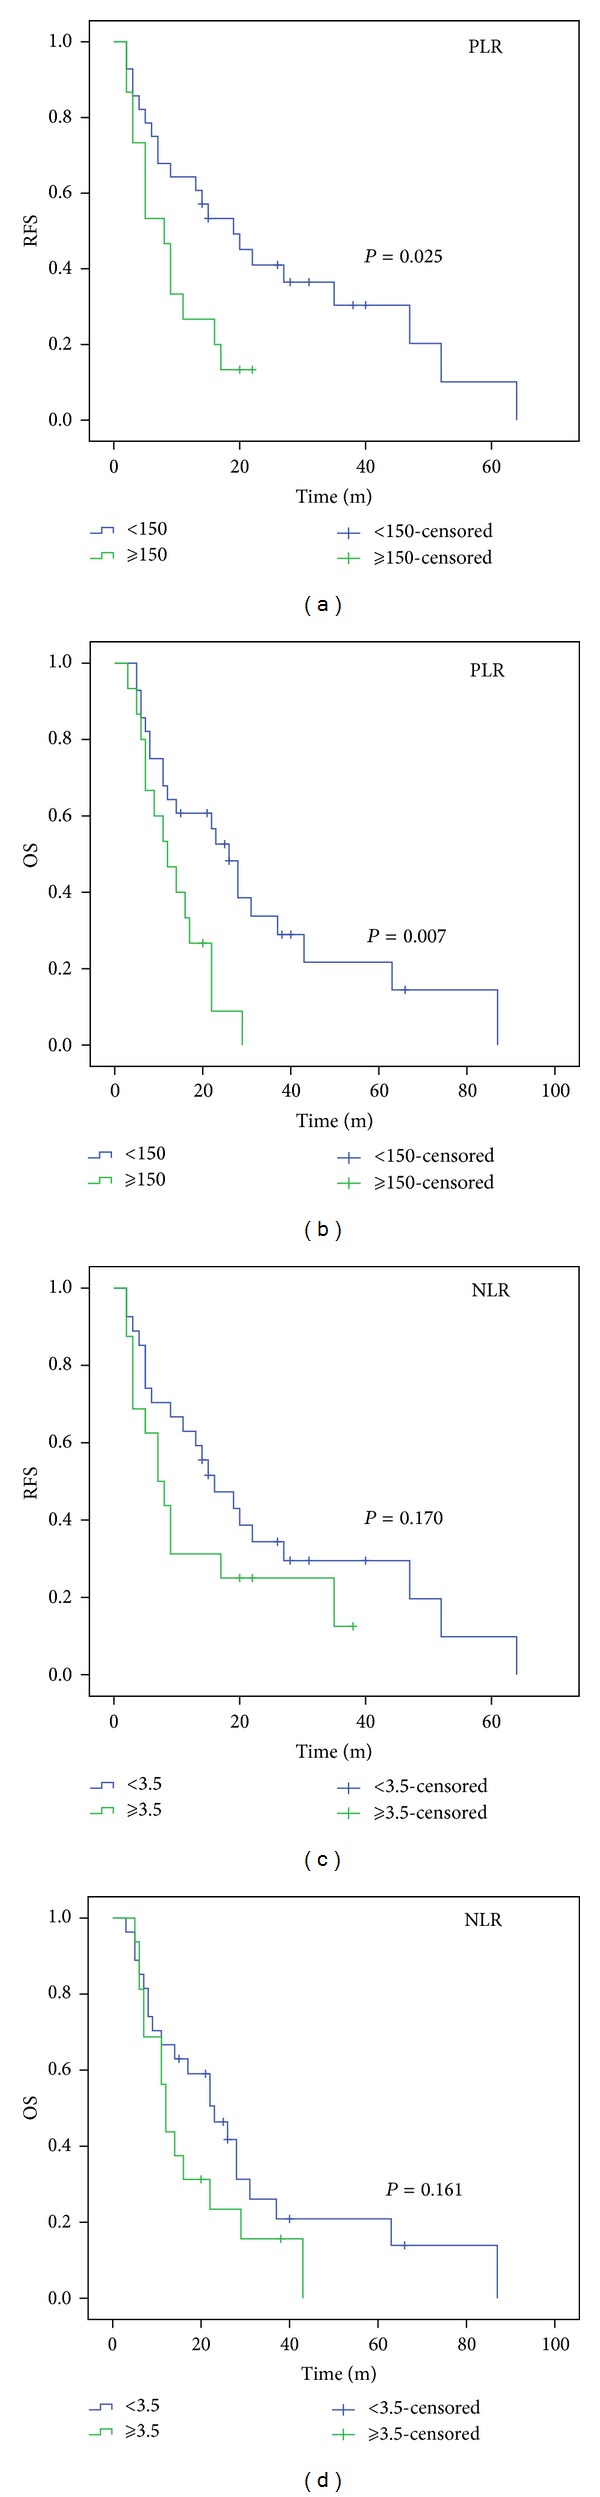
RFS (a) and OS (b) in PLR categories. RFS (c) and OS (d) in NLR categories. Patients with PLR ≥150 had significantly poorer RFS (13.3% versus 25.0%, P = 0.025) (a) and OS (6.7% versus 25.0%, P = 0.007) (b) compared to patients with PLR <150. However, RFS (22.2% versus 18.8%, P = 0.170) (c) and OS (22.2% versus 12.5%, P = 0.161) did not differ according to NLR categories ((c) and (d)).