
Figure 3.
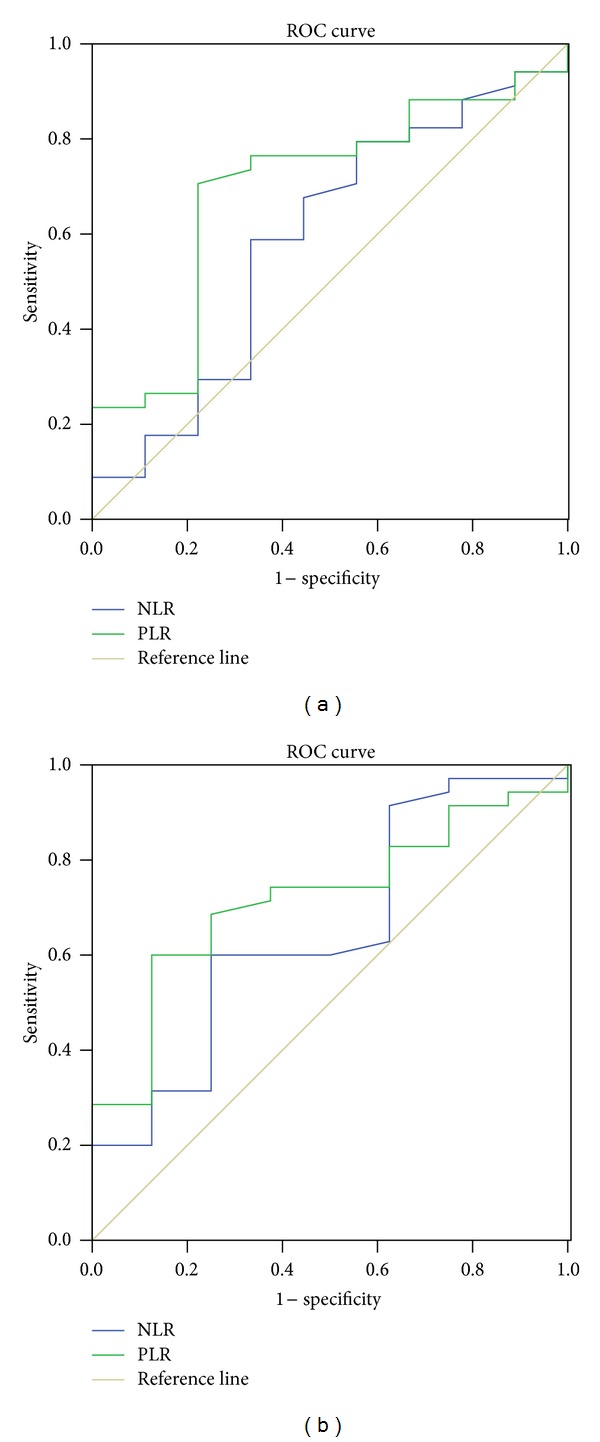
ROC curves for RFS (a) and OS (b) prediction. ROC curves were plotted to verify the accuracy of NLR and PLR for RFS and OS prediction. The AUC were 0.588 for NLR and 0.694 for PLR according to RFS prediction (a). The AUC were 0.650 for NLR and 0.720 for PLR according to OS prediction (b).