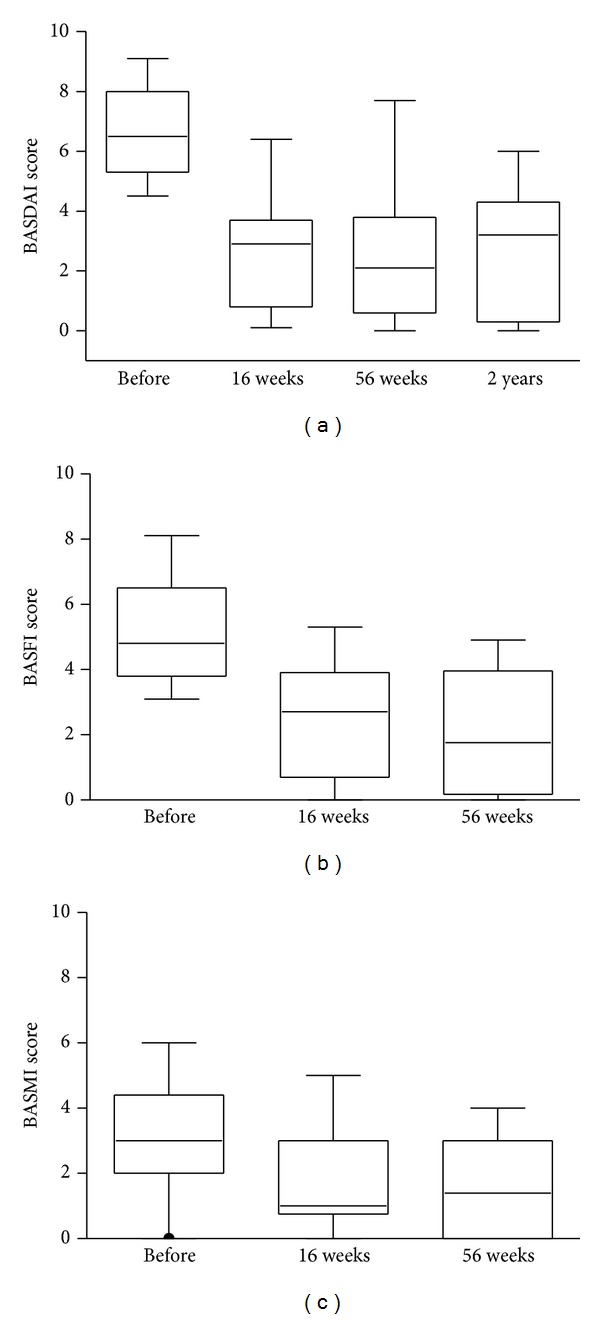
Figure 3.

Change in BASDAI, BASFI, and BASMI scores over time. Box plots show the 25th and 75th percentiles. Horizontal solid lines within boxes indicate medians and vertical bars indicate the 5th and 95th percentiles.

Change in BASDAI, BASFI, and BASMI scores over time. Box plots show the 25th and 75th percentiles. Horizontal solid lines within boxes indicate medians and vertical bars indicate the 5th and 95th percentiles.