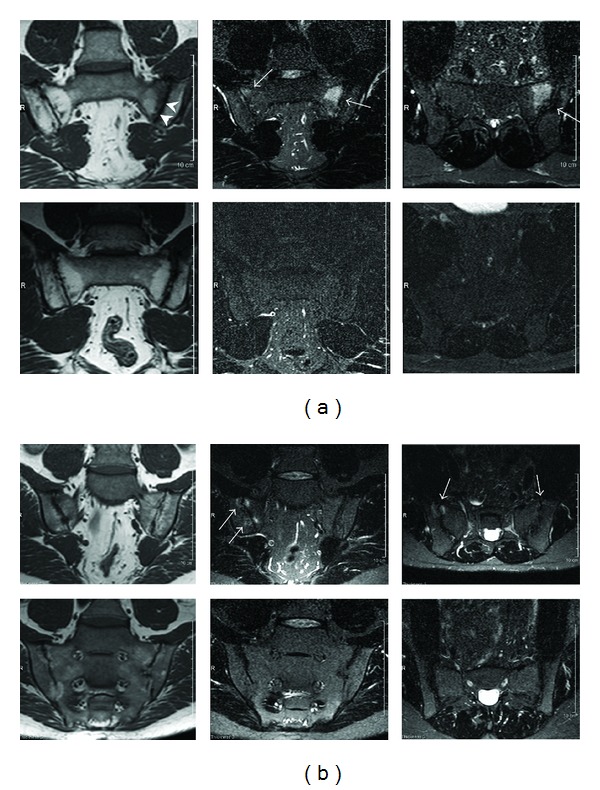
Figure 4.

(a) A representative MRI study at inclusion (top row) with bilateral inflammatory changes (arrows). There is a 2 × 3 cm high signal intensity lesion on the sacral side of the left sacroiliac joint on the STIR images (coronal and axial) with corresponding low signal intensity on the coronal T1-weighted image. At the right sacroiliac joint, there are smaller and more subtle lesions on both sides of the joint. There are sclerotic changes along the left joint (arrowheads). At 16 weeks (bottom row), no oedematous lesions can be seen. (b) An MRI study showing bilateral sacroiliitis in an AS patient at inclusion and at 16 weeks. At inclusion, there are bilateral inflammatory changes on the MRI images (top row, arrows). At the right sacroiliac joint, there is a 1 × 1 cm high signal intensity lesion in the sacrum on the STIR images (coronal and axial) with corresponding low signal intensity on the coronal T1-weighted image. On the left, there are smaller and more subtle lesions on both sides of the joint. There are sclerotic changes along the right sacroiliac joint. At 16 weeks (bottom row), no oedematous lesions can be seen.
