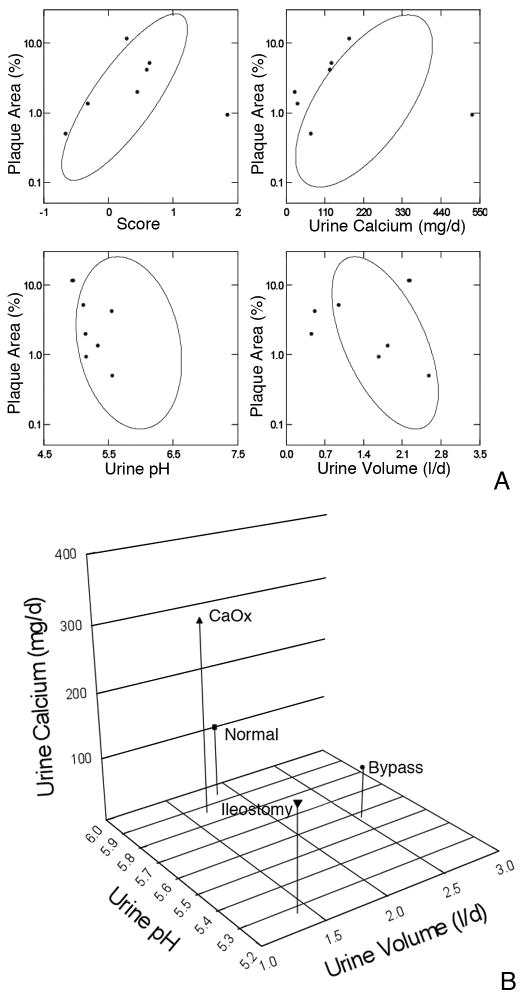
Figure 3. Comparison of present plaque data to our prior reports.
3A: Percent plaque coverage of renal papillae gauged via intra-operative digital imaging (y axes of all 4 panels) varied in our prior reports (9) of normal, idiopathic calcium stone formers and obesity bypass patients as in the elliptical confidence bands shown on each panel. The present 7 patients are over plotted in grey symbols. In general, the patients fall along or within the ellipses. 3B: Compared to our prior study cases ileostomy patients have much lower pH as a predominant cause of plaque, and moderately lower urine volume and calcium excretion. Values are means.

