
Fig. 5.
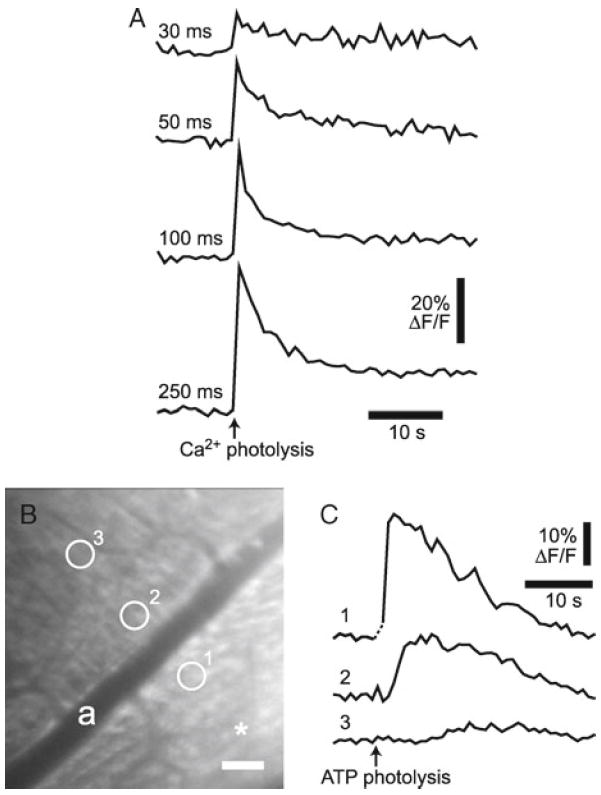
Glial cell Ca2+ increases. (a) Intracellular glial Ca2+ increases evoked by photolysis of caged Ca2+. Photolysis evokes Ca2+ increases proportional to the duration of the photolysis flash. Numbers indicate flash duration for each trial. (b, c) Glial Ca2+ increases and a propagated Ca2+ wave evoked by photolysis of caged ATP. (b) A confocal image of the retina showing OGB-labeled glial cells. Asterisk indicates the site of caged ATP photolysis; scale bar, 50 μm. (c) Stimulation of glial cells by photolysis of caged ATP in the vitreous humor evokes Ca2+ increases in the stimulated cells and initiates a propagated Ca2+ wave. Ca2+ is measured in the three regions indicated in (b).