
Figure 2.
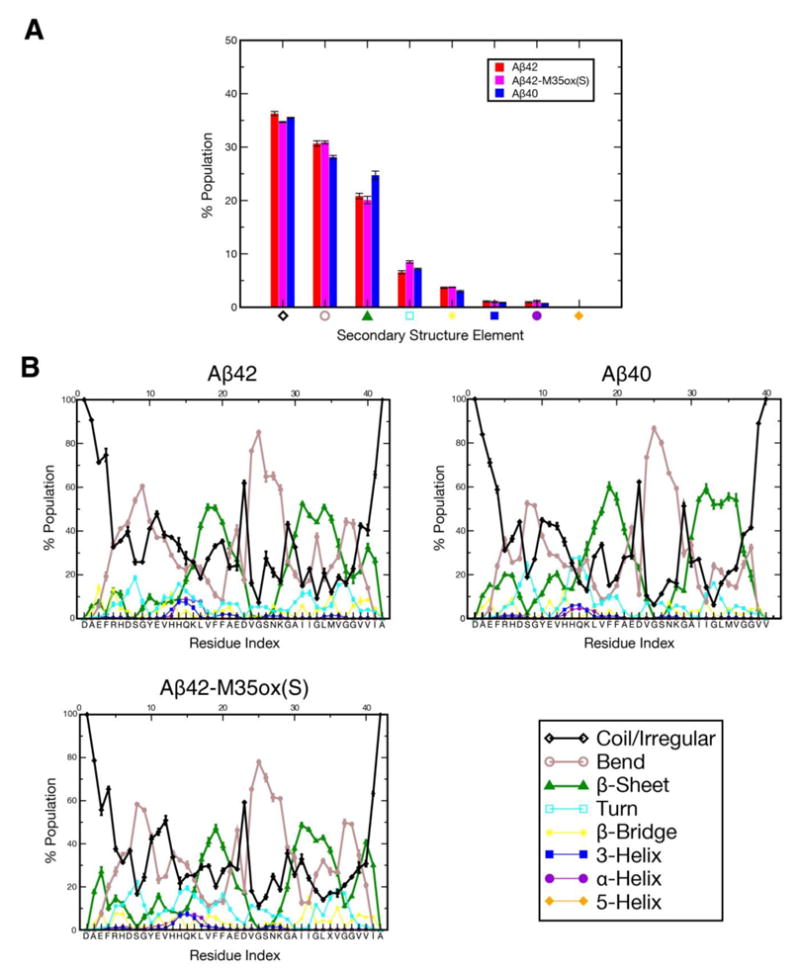
Percent composition of secondary structure as determined by DSSP54,55 for each of the three Aβ species, averaged over the production ensemble a) over all residues and b) as a function of residue index. Of particular importance are the three dominant secondary structure elements in the ensemble, denoted with thicker lines in the graph: coil/irregular in black, bend in grey, and β-sheet in green.